ActionsPulse 🚀
![]()
![]()
Real-time GitHub Actions observability through VS Code with GitHub Copilot
DORA Metrics • Cost Analysis • CI/CD Health • Security Compliance
☝️ This is an actual interactive HTML dashboard generated by ActionsPulse — see full tour below
✨ What is ActionsPulse?
ActionsPulse is an Agentic MCP Server that brings DevOps observability directly into your IDE. Ask GitHub Copilot questions like:
💬 "Show me our DORA metrics for the last 30 days"
💬 "Which workflows are costing us the most?"
💬 "Generate a compliance report for SOC2"
💬 "What's our deployment frequency this month?"
And get interactive visual dashboards with actionable insights.
🎯 Features
| Feature | Organization | Enterprise |
|---|---|---|
| 📊 DORA Metrics | ✅ | ✅ Enhanced |
| ⚡ Performance Analytics | ✅ | ✅ |
| 💰 Cost Optimization | ✅ | ✅ Cross-org |
| 🏃 Runner Utilization | ✅ Self-hosted | ✅ All runners |
| 👥 Team Productivity | ✅ | ✅ |
| 🔒 Compliance Reports | ✅ (GHAS) | ✅ |
| 💾 Cache Analytics | ✅ | ✅ |
| 🎓 Maturity Assessment | ✅ | ✅ |
🖼️ Dashboard Tour
ActionsPulse generates interactive HTML dashboards that you can open in any browser. Simply ask Copilot:
💬 "Generate DevOps reports for my organization"
Or use the generate_devops_reports tool directly. Here's a complete tour of what you get:
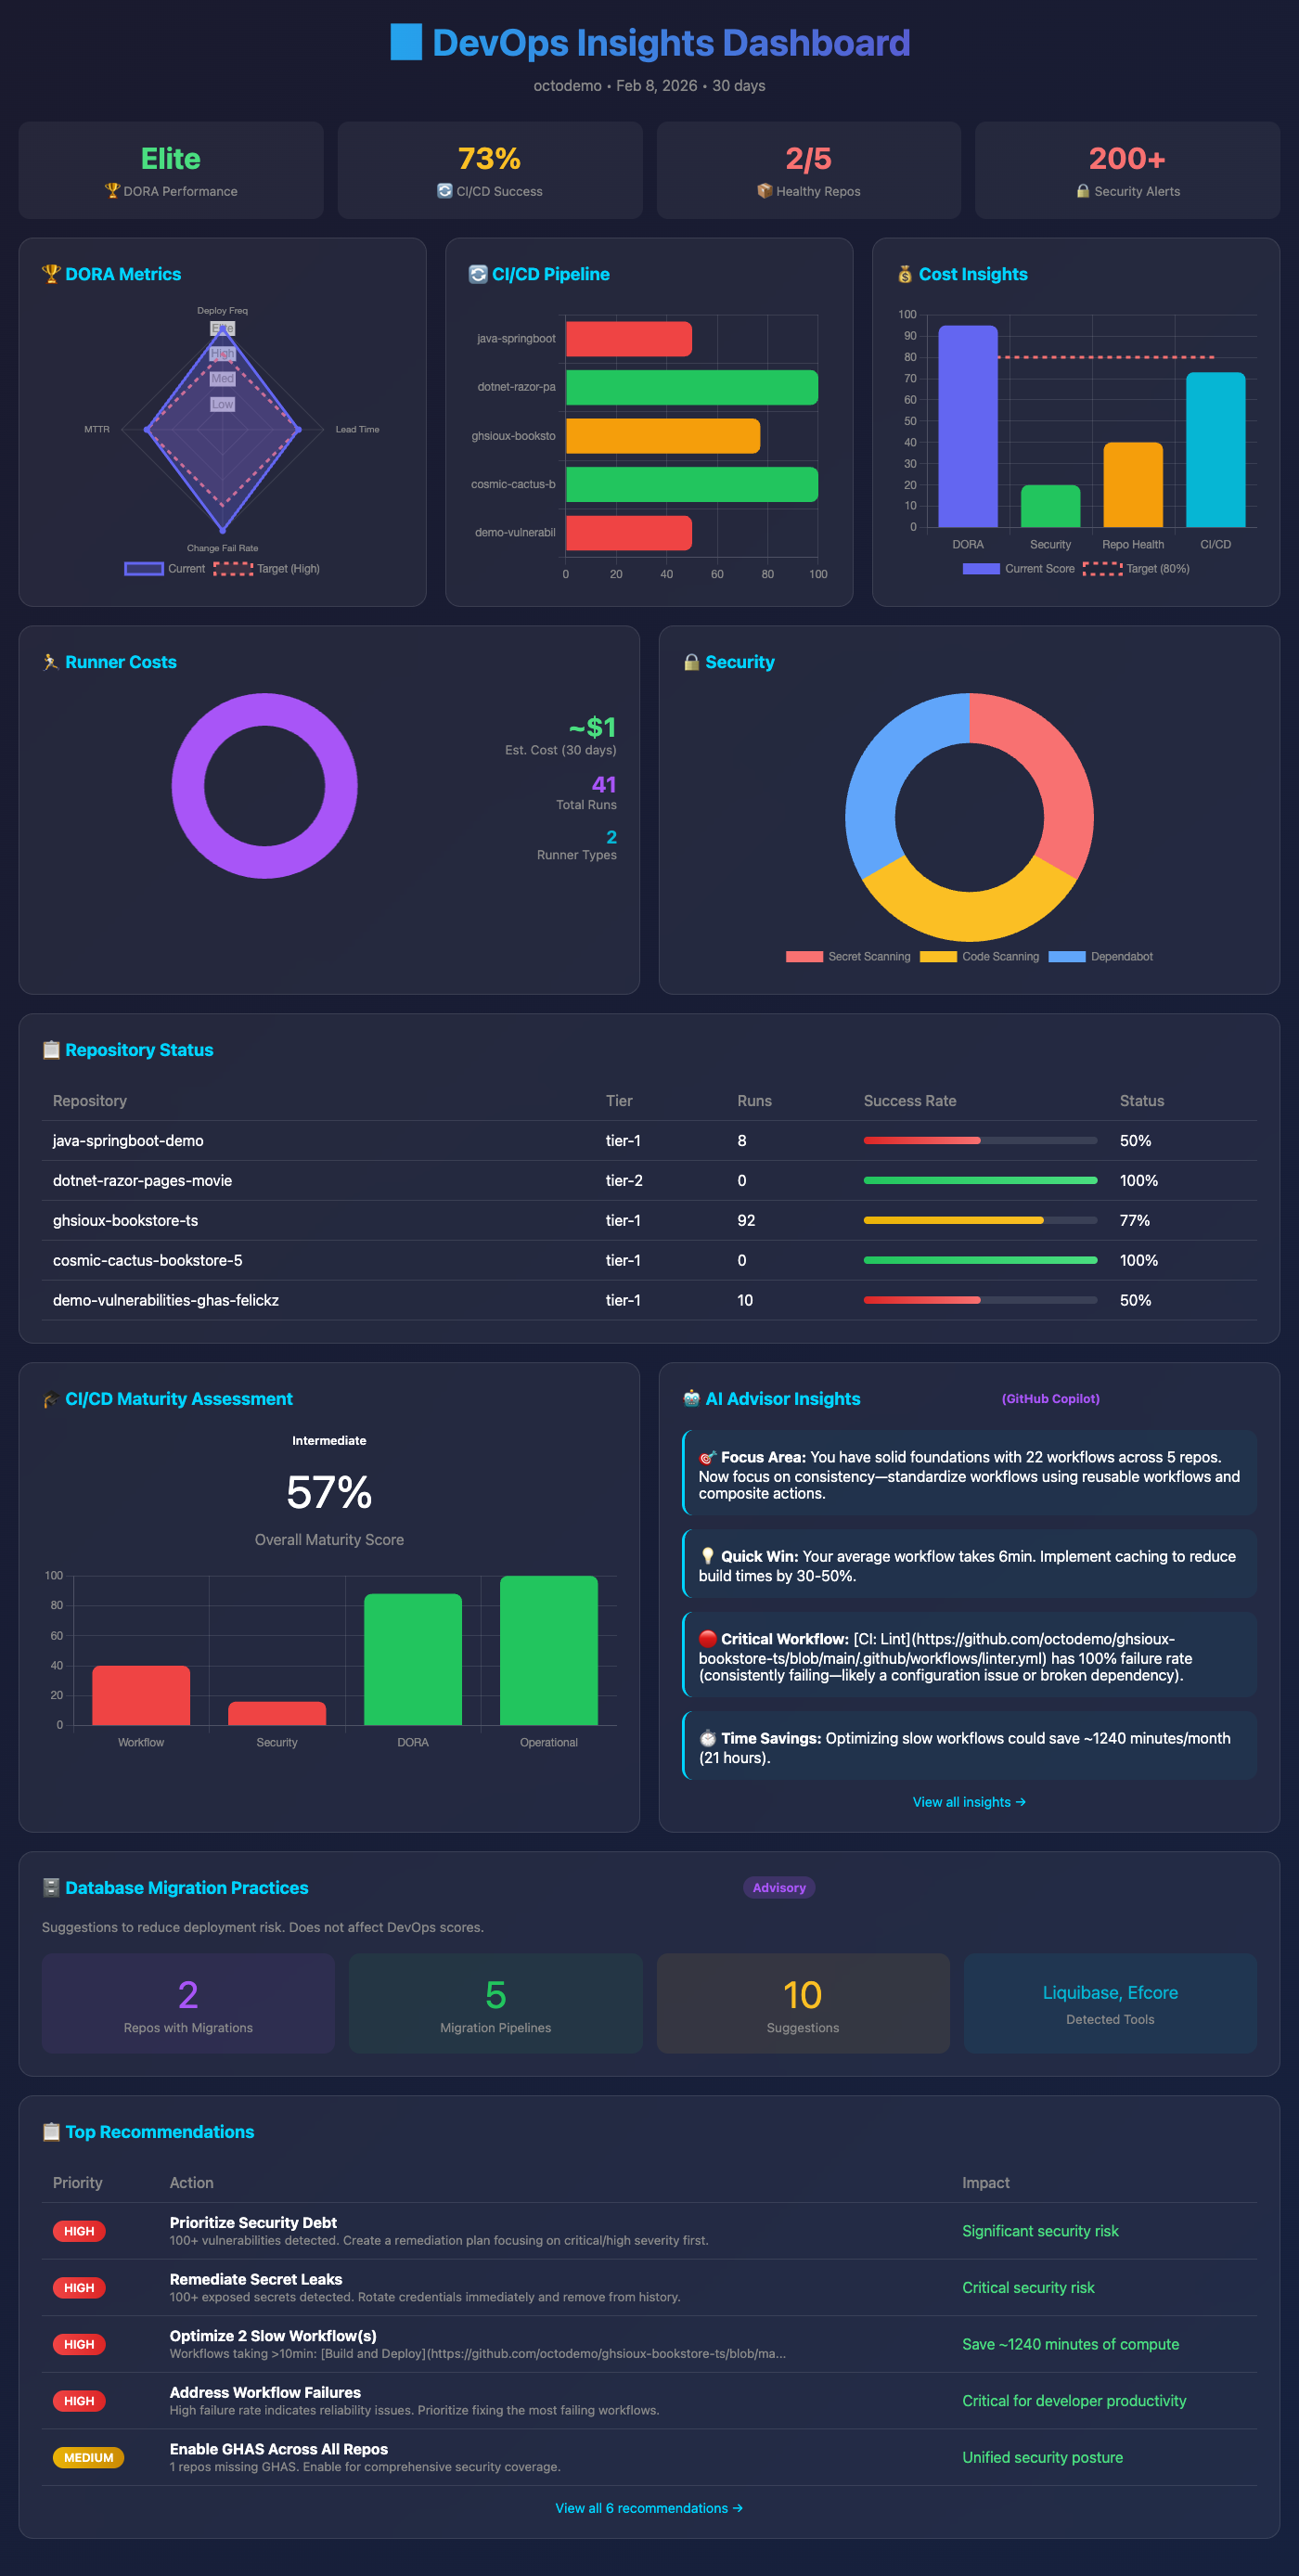
📊 Dashboard Overview — Executive summary with all key metrics at a glance
The main dashboard provides:
- 🎯 DevOps Maturity Score with visual gauge
- 📈 DORA Metrics summary (Deployment Frequency, Lead Time, Change Failure Rate, MTTR)
- ⚡ CI/CD Pipeline health overview
- 💰 Cost analysis highlights
- 🔒 Security & compliance status
- Quick navigation to detailed reports
📈 DORA Metrics — Industry-standard DevOps performance indicators
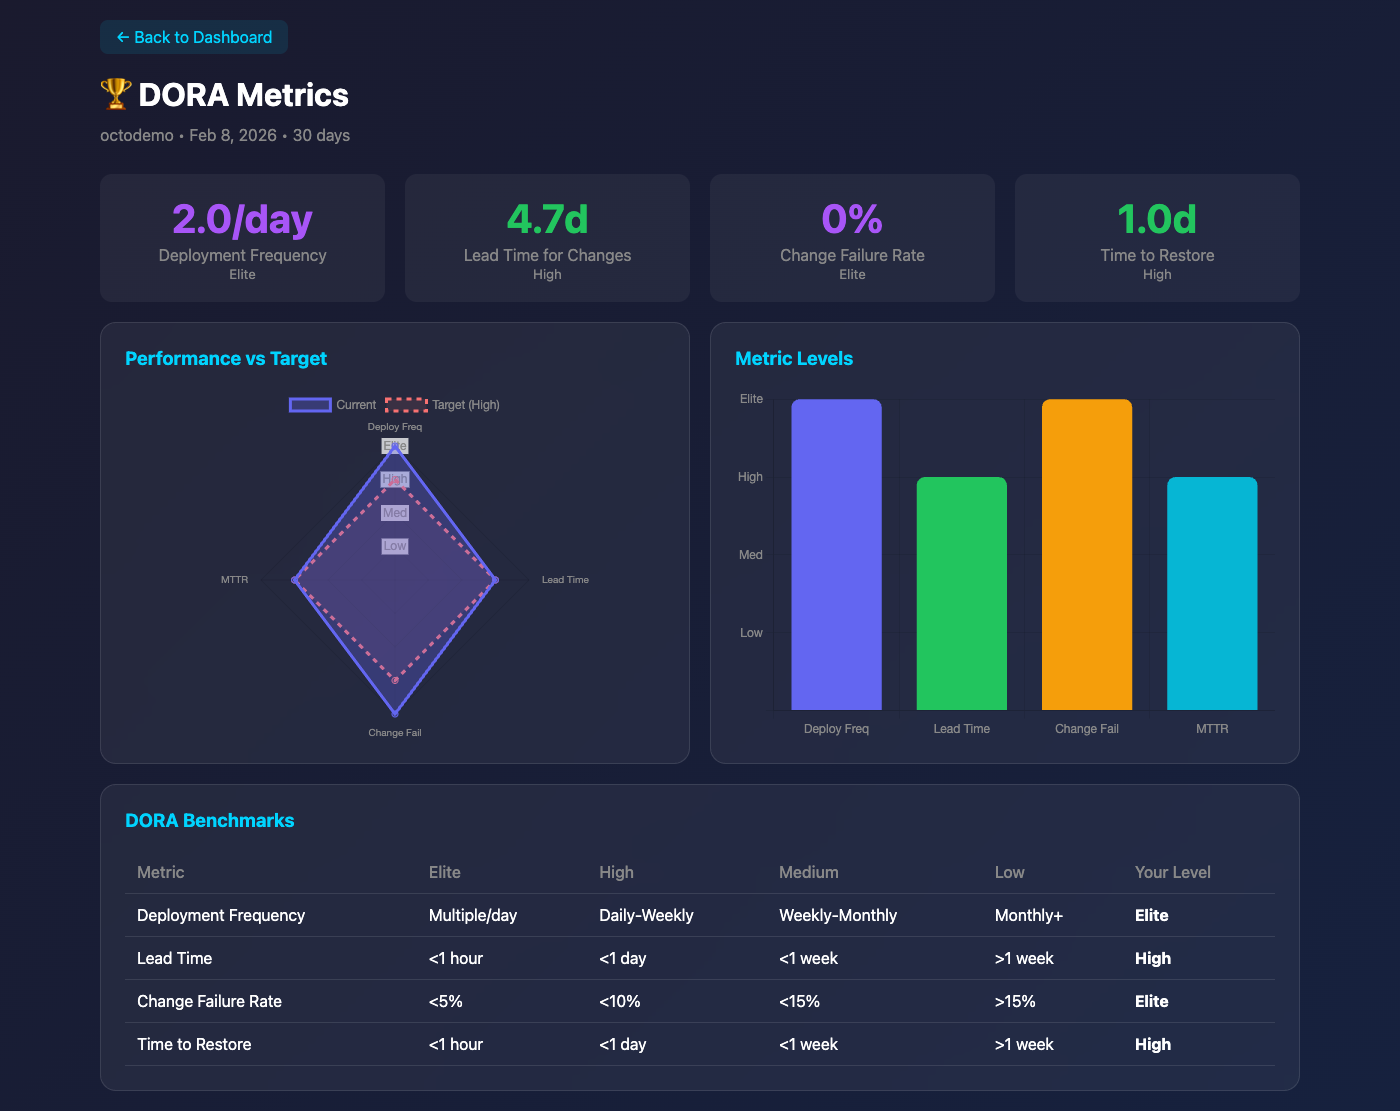
Track the four key DORA metrics:
- Deployment Frequency — How often you ship to production
- Lead Time for Changes — Time from commit to production
- Change Failure Rate — Percentage of deployments causing failures
- Mean Time to Restore — How quickly you recover from incidents
Each metric includes trend analysis and benchmarks against industry standards (Elite, High, Medium, Low performers).
⚡ CI/CD Pipeline Health — Workflow performance and reliability
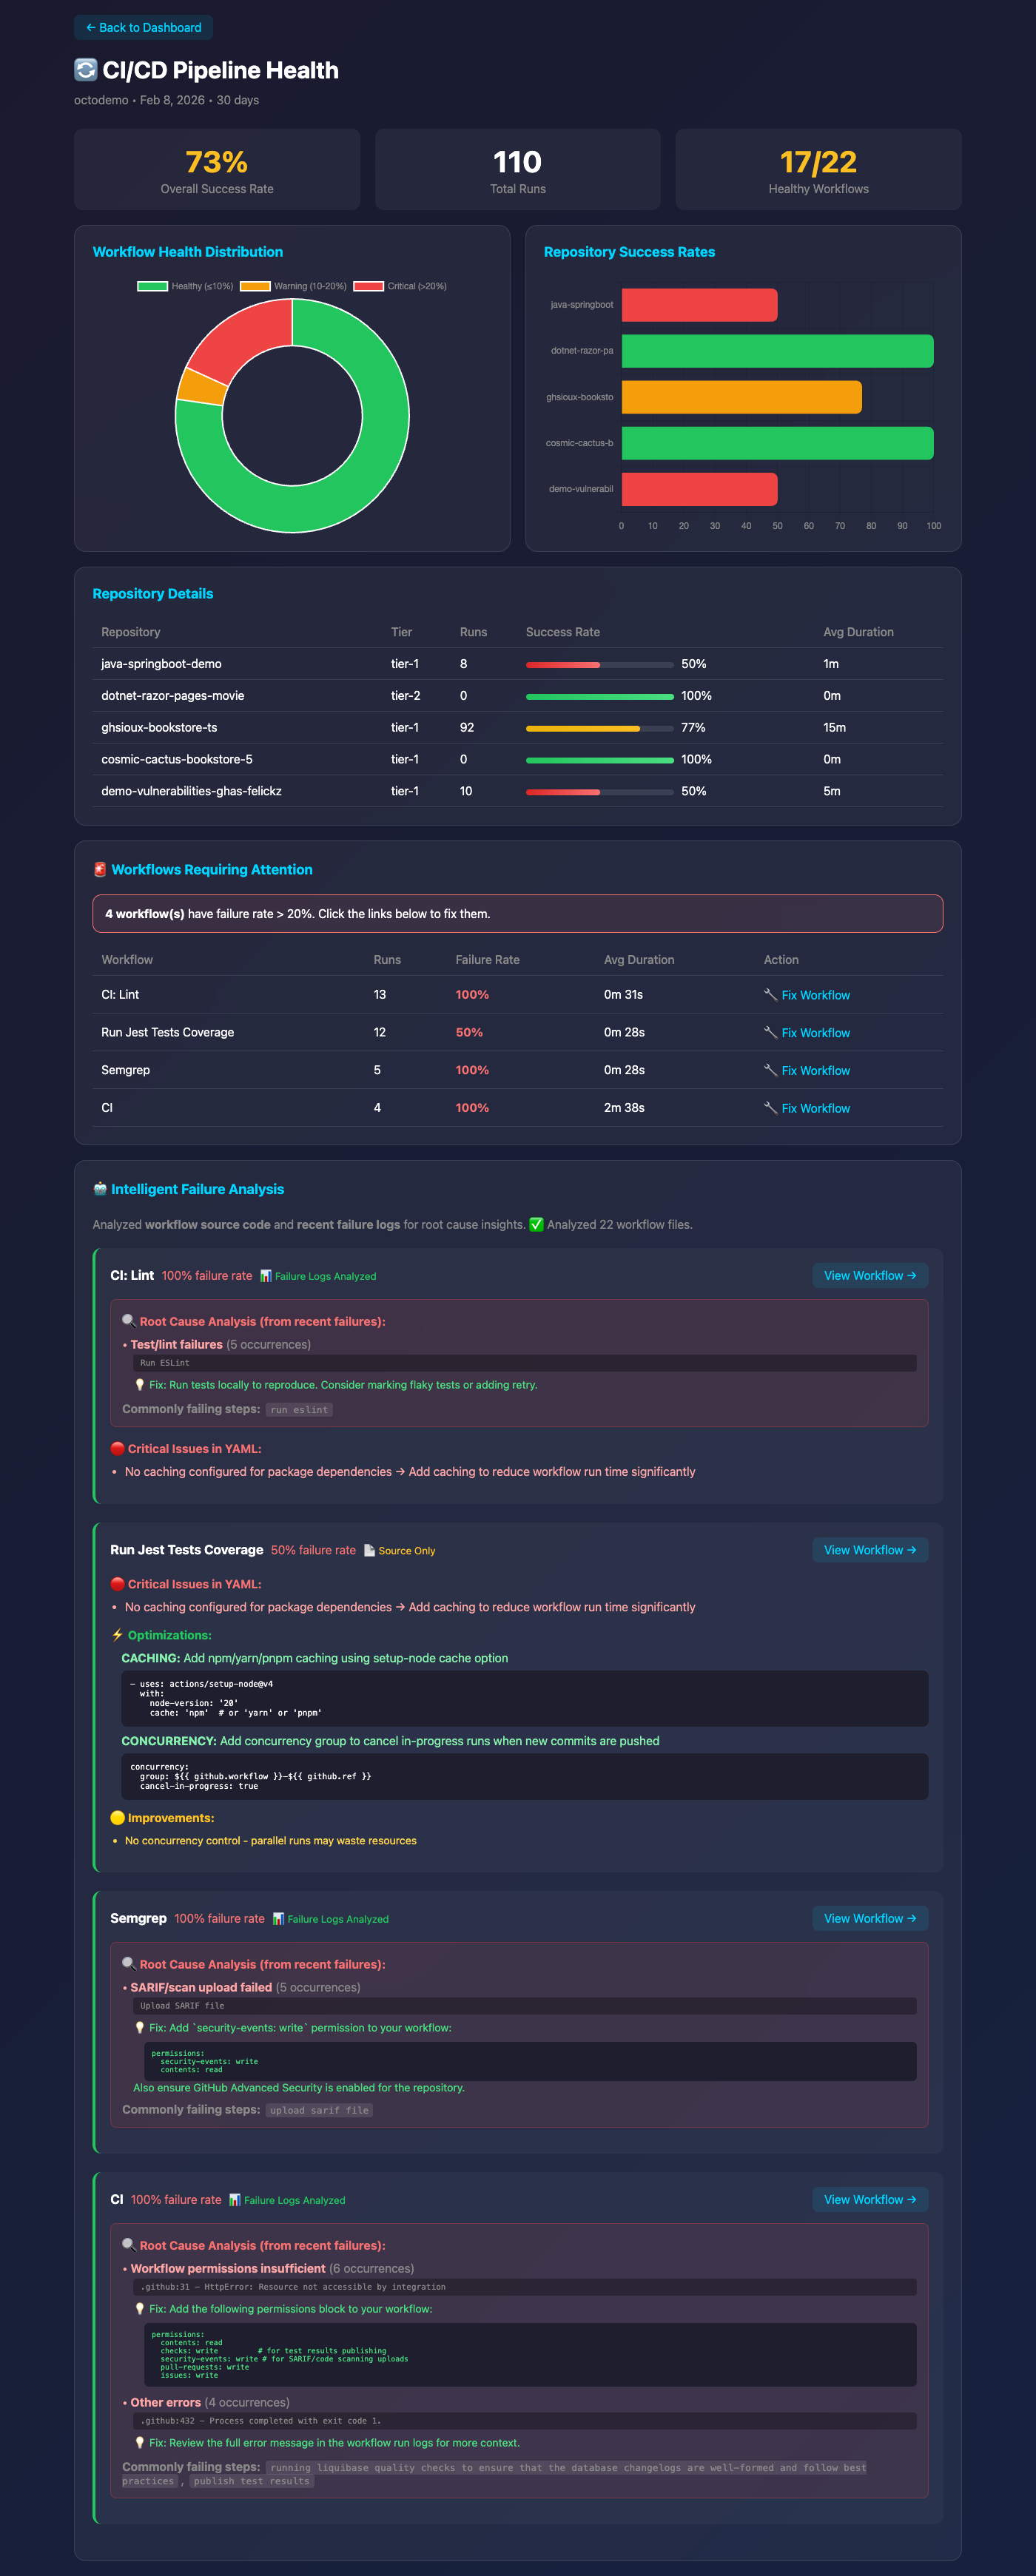
Deep dive into your CI/CD pipelines:
- 🔄 Workflow success rates and trends
- ⏱️ Average run times with P95/P99 latencies
- 🚨 Failure analysis and common error patterns
- 📊 Per-repository and per-workflow breakdowns
- 🏃 Queue times and runner utilization
💰 Cost Optimization — Runner costs and savings opportunities
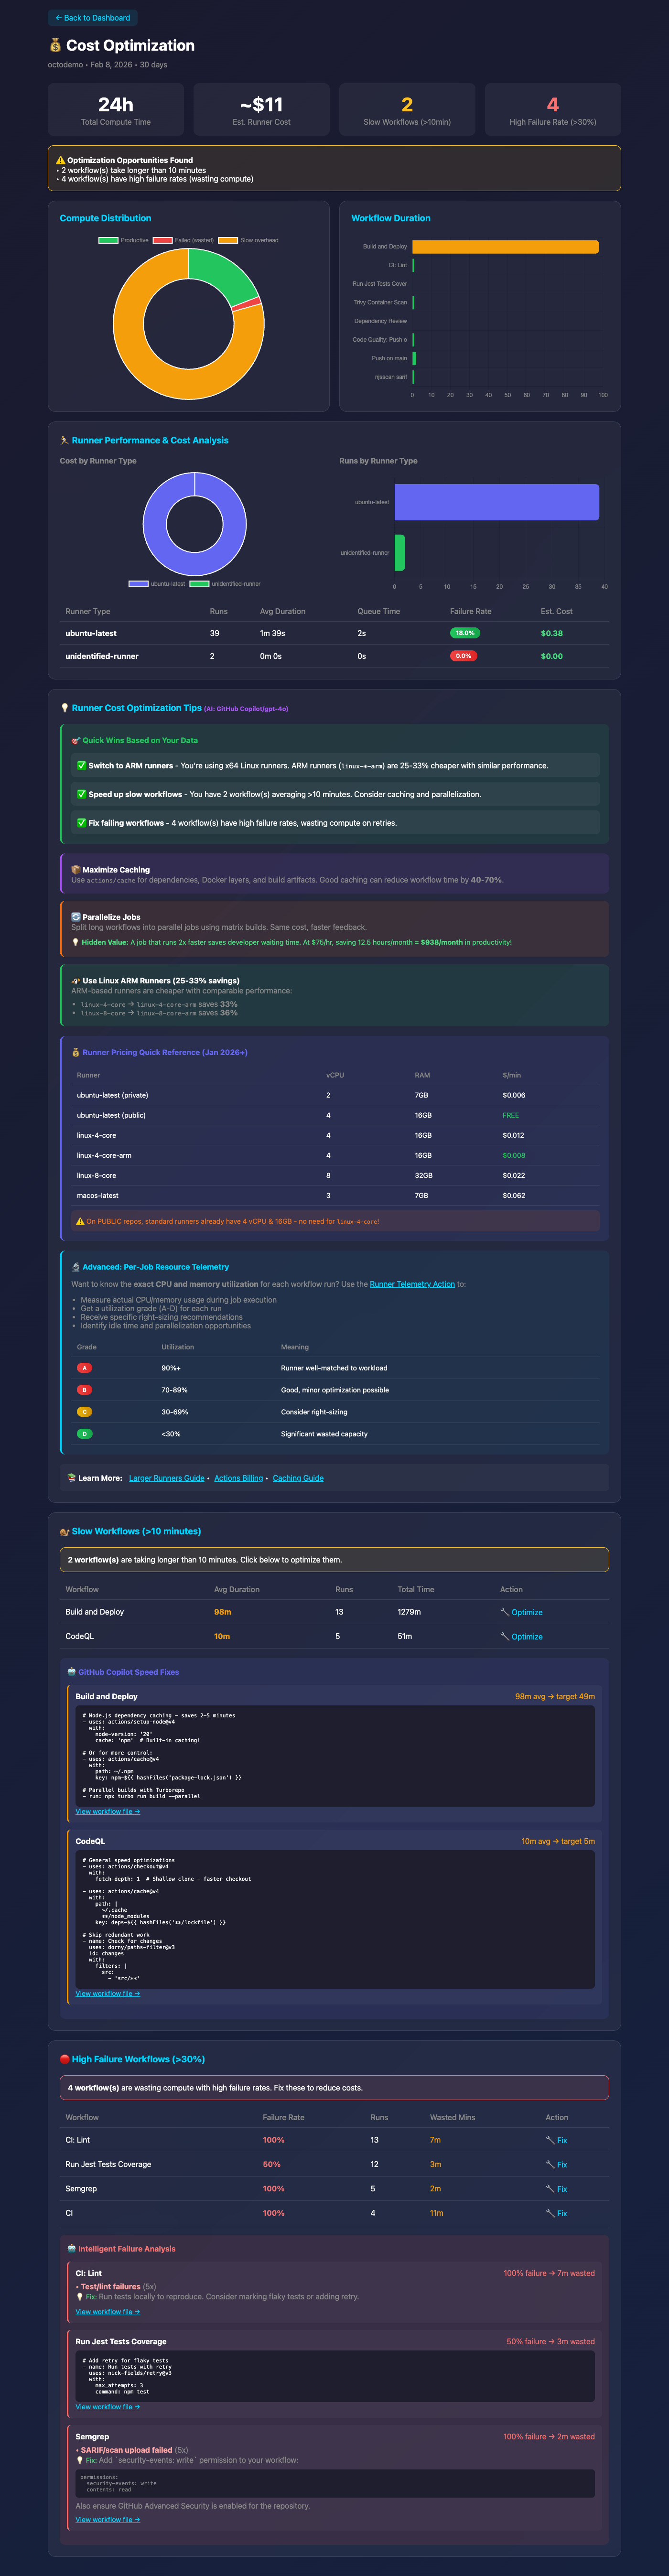
Understand and optimize your GitHub Actions spending:
- 💵 Total costs by runner type (GitHub-hosted vs self-hosted)
- 📊 Cost breakdown by repository, workflow, and OS
- 🎯 Actionable recommendations for cost savings
- 📈 Spending trends and projections
- ⚡ Efficiency metrics (cost per workflow, cost per minute)
🔒 Security & Compliance — Audit-ready compliance reports
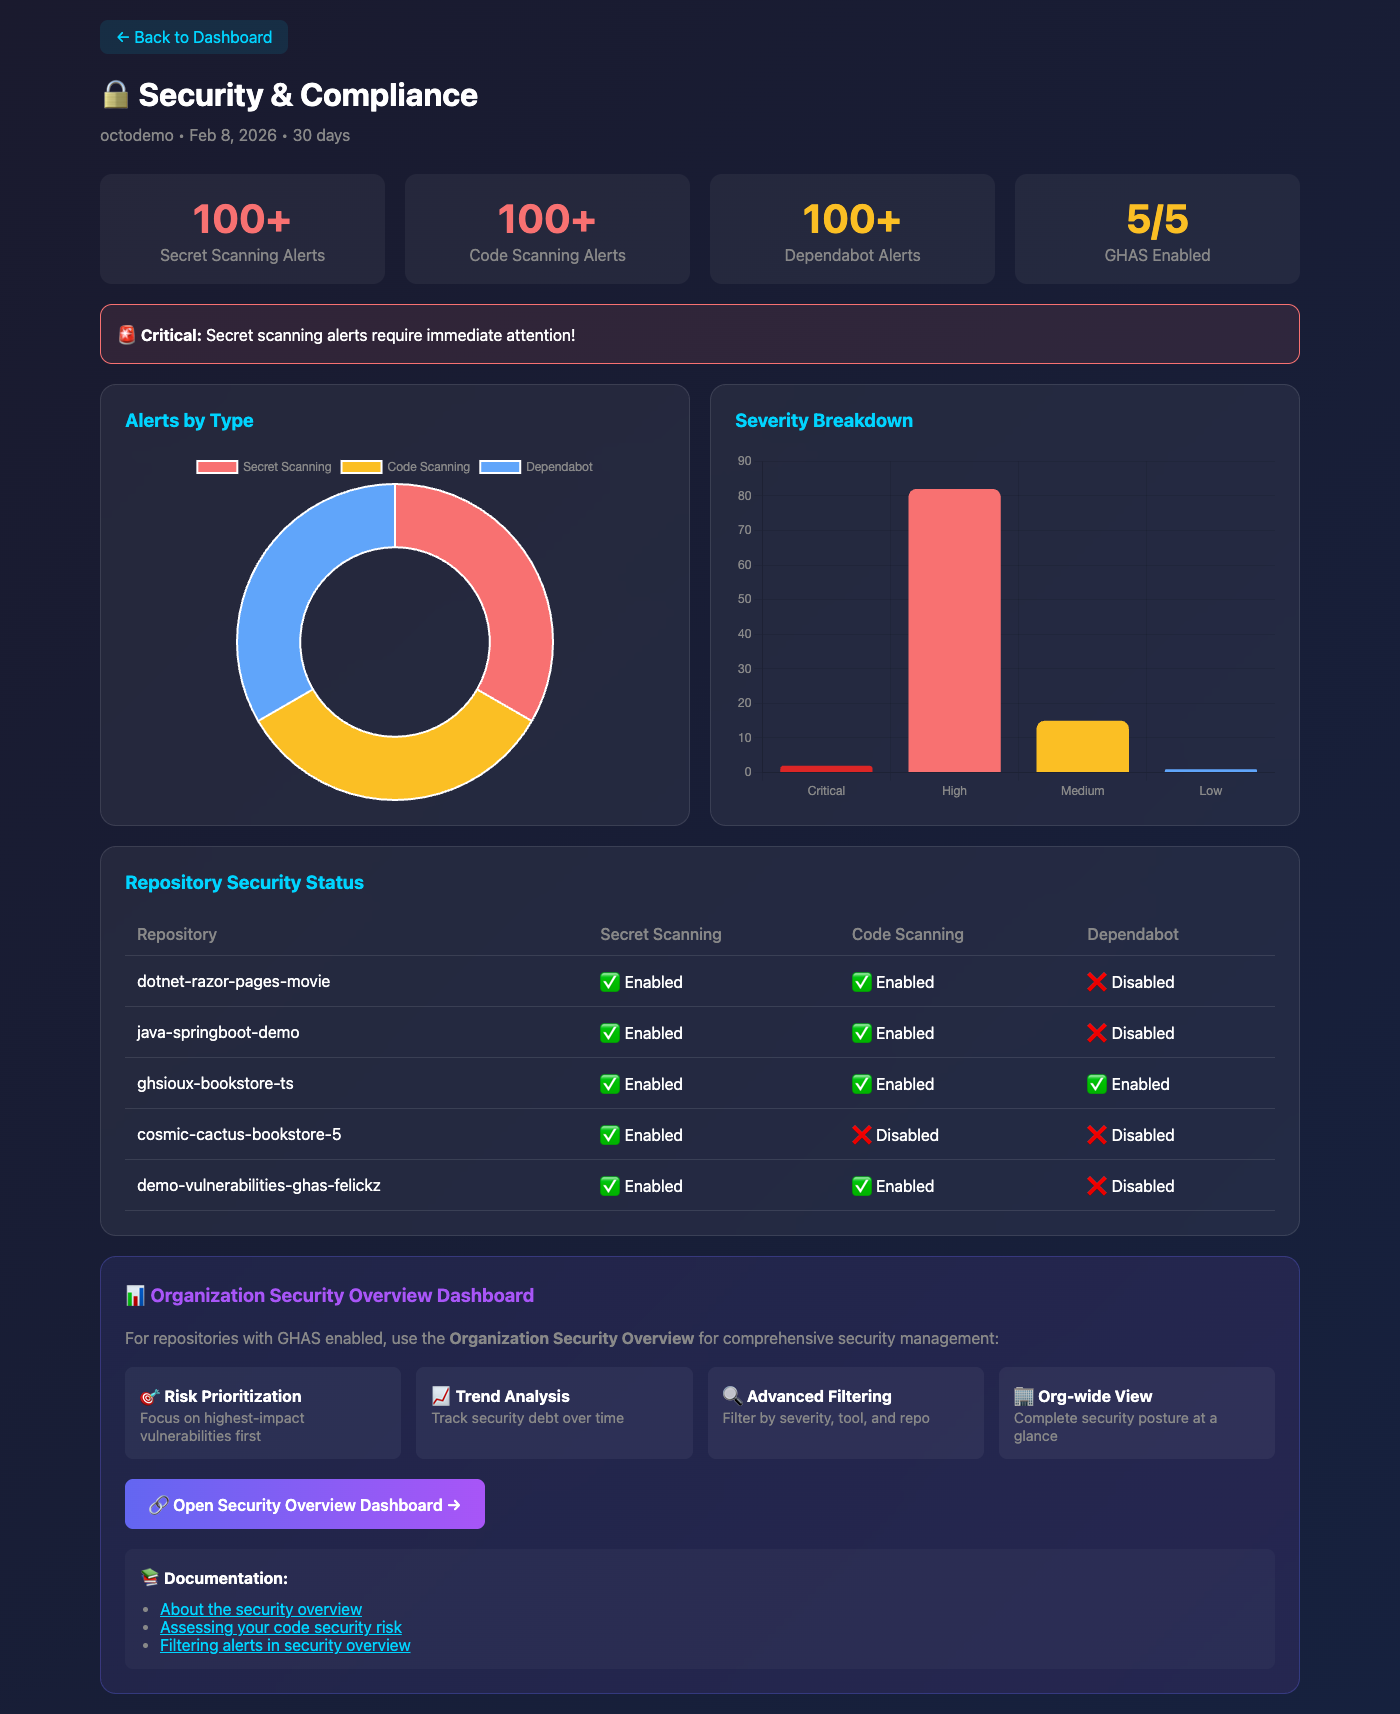
Stay compliant and secure:
- ✅ Compliance framework coverage (SOC2, ISO27001, HIPAA, PCI-DSS)
- 🔍 Secret scanning status and alerts
- 🛡️ Code scanning findings
- 📋 Branch protection rule compliance
- 🔐 GHAS (GitHub Advanced Security) feature adoption
🎓 DevOps Maturity — Organizational capability assessment
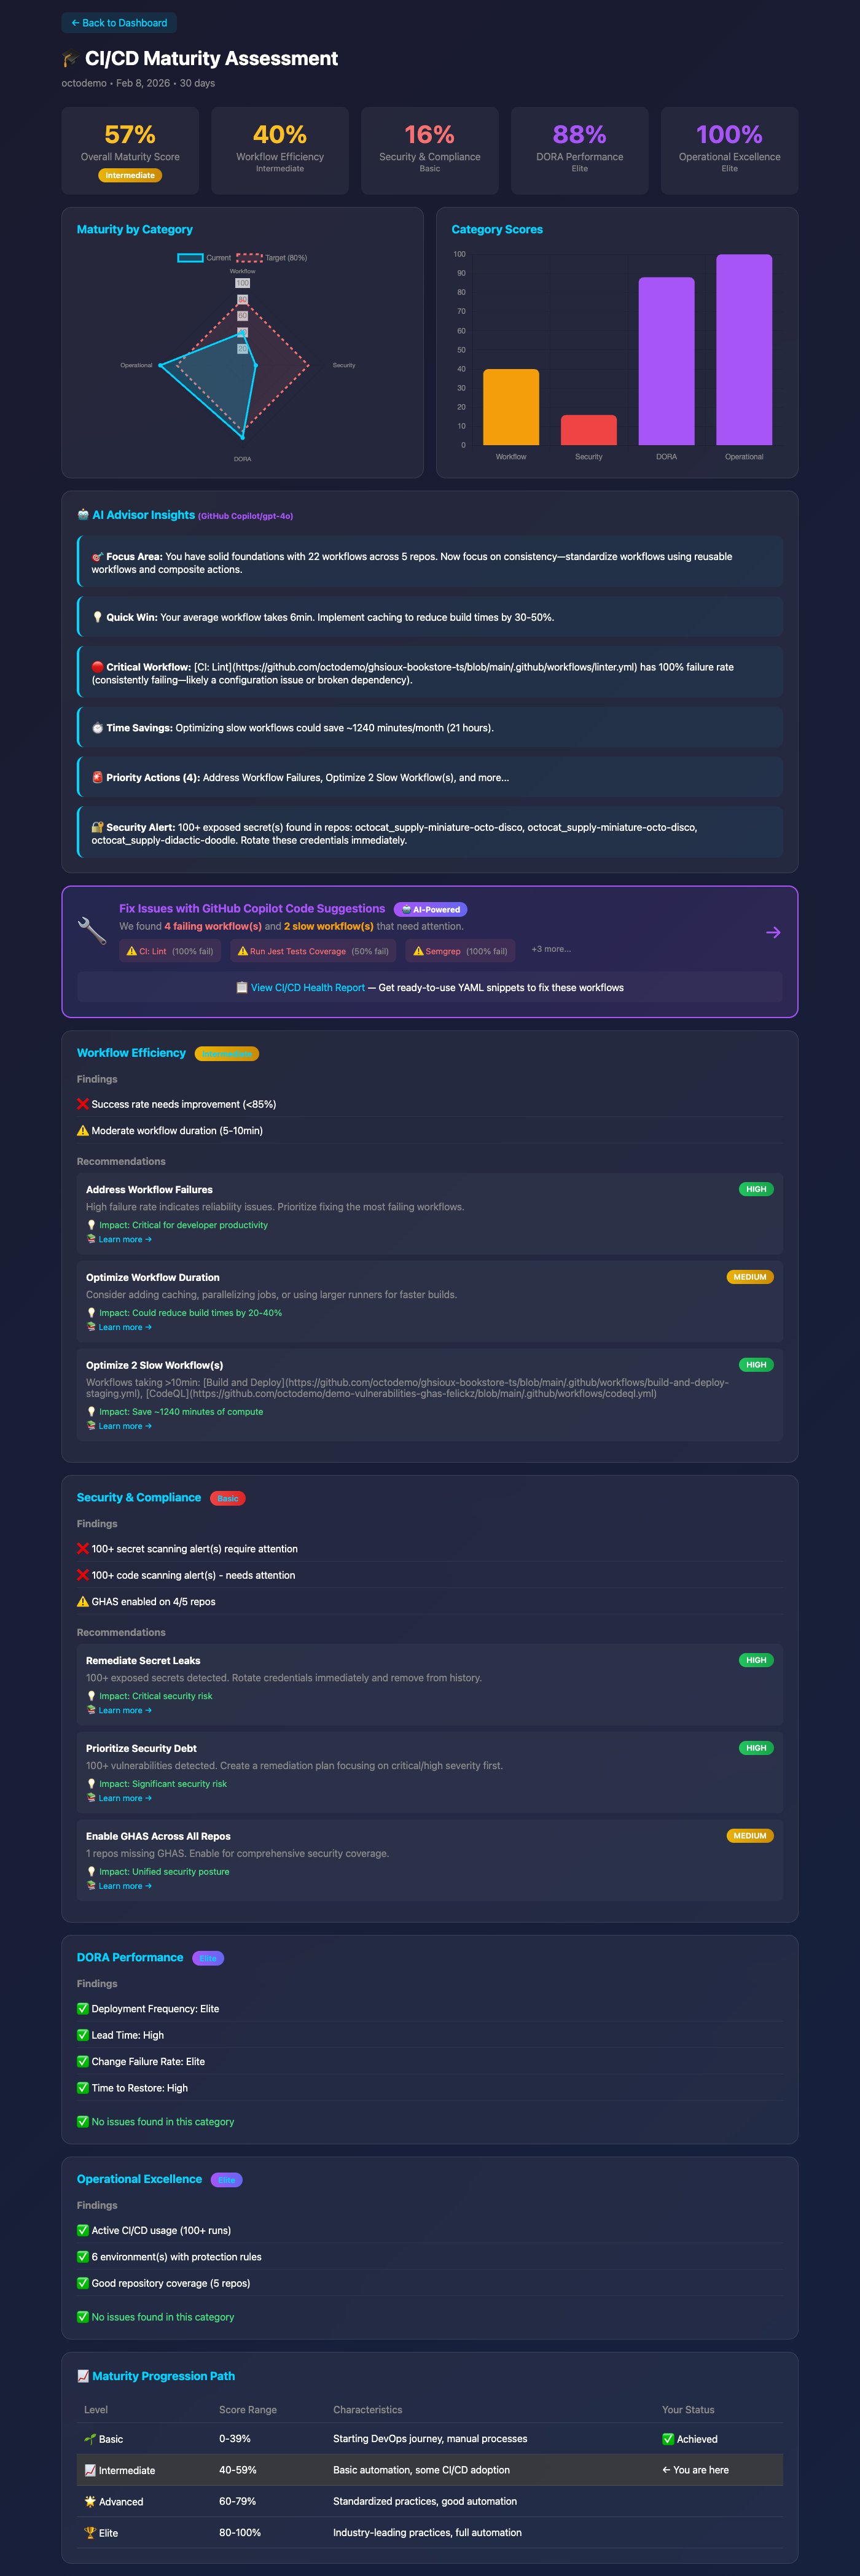
Assess your DevOps maturity level:
- 📊 Overall maturity score with visual gauge
- 🎯 Category scores (CI/CD, Testing, Security, Monitoring, etc.)
- 📈 Improvement recommendations prioritized by impact
- 🏆 Benchmark against industry standards
- 📋 Actionable roadmap for advancement
💡 How to generate these dashboards:
# Ask Copilot in natural language:
"Generate DevOps reports for the last 30 days"

# Or invoke the tool directly:
#generate_devops_reports --timeframe 30d
Reports are saved to timestamped folders as standalone HTML files — share them with your team or embed in internal wikis!
🚀 Quick Start
Install from MCP Registry
ActionsPulse is published to the official MCP Registry as io.github.tsviz/actions-pulse.
🌐 Web UI (Recommended) — Use the MCP Registry UI for 1-click installation into VS Code or Cursor:
- Go to vemonet.github.io/mcp-registry
- Search for "actions-pulse"
- Click Install → Select your client (VS Code, Cursor)
- Configure environment variables when prompted
Manual Docker Setup — Or follow the steps below to configure manually.
Prerequisites
- ✅ Docker installed
- ✅ GitHub Personal Access Token (fine-grained recommended)
- ✅ VS Code with GitHub Copilot
1. Create a Fine-Grained Personal Access Token
-
Go to GitHub Settings → Developer Settings → Personal Access Tokens → Fine-grained tokens
-
Click Generate new token
-
Configure basic settings:
- Token name:
actions-pulse-mcp - Expiration: 90 days (or per your security policy)
- Resource owner: Select your organization
- Repository access: All repositories
- Token name:
-
Set Repository permissions:
Permission Access Required Purpose Actions Read ✅ Yes Workflow runs, cache usage Administration Read ✅ Yes Billing data, repo settings Contents Read ✅ Yes Read config files from devops-config repo Custom properties Read ✅ Yes Read custom property values on repositories Deployments Read ✅ Yes Deployment frequency, environments (DORA) Discussions Read 🔶 Optional Community engagement metrics Environments Read ✅ Yes Environment protection rules Issues Read ✅ Yes Issue metrics, resolution times (DORA) Merge queues Read 🔶 Optional Merge queue adoption and wait times Metadata Read ✅ Yes Basic repo info (auto-granted) Pull requests Read ✅ Yes PR metrics, lead time, review times (DORA) -
Set Organization permissions:
Permission Access Required Purpose Custom properties Read ✅ Yes Read property definitions/schemas at org level Custom properties for organizations Read ✅ Yes Read property values assigned to repositories -
Set Organization permissions (continued):
Permission Access Required Purpose Members Read 🔶 Optional Team membership for productivity metrics Self-hosted runners Read 🔶 Optional Runner utilization metrics Administration Read ✅ Yes Org billing and settings -
Optional permissions (for compliance features, requires GitHub Advanced Security):
Permission Access Required Purpose Secret scanning alerts Read ❌ Optional Compliance audit reports Code scanning alerts Read ❌ Optional Compliance audit reports -
Click Generate token and save it securely
2. Configure MCP Server
Option A: Using env-file (Recommended)
Add to your ~/.mcp.env:
GITHUB_TOKEN=ghp_your_fine_grained_token_here
📄 mcp.json with env-file
Add to VS Code's MCP settings (~/.vscode/mcp.json or workspace .vscode/mcp.json):
{
  "servers": {
    "actions-pulse": {
      "command": "docker",
      "args": [
        "run", "-i", "--rm",
        "--env-file", "/path/to/.mcp.env",
        "-e", "GITHUB_ORG=your-org-name",
        "ghcr.io/tsviz/actions-pulse:latest"
      ],
      "type": "stdio"
    }
  }
}
Option B: Direct Environment Variables
📄 mcp.json with inline env vars
{
  "servers": {
    "actions-pulse": {
      "command": "docker",
      "args": [
        "run", "-i", "--rm",
        "-e", "GITHUB_TOKEN=ghp_your_token",
        "-e", "GITHUB_ORG=your-org-name",
        "ghcr.io/tsviz/actions-pulse:latest"
      ],
      "type": "stdio"
    }
  }
}
3. Environment Variables Reference
| Variable | Required | Description |
|---|---|---|
GITHUB_TOKEN | ✅ Yes | Personal Access Token (fine-grained recommended) |
GITHUB_ORG | ✅ Yes | Target GitHub organization to monitor (e.g., my-company). All API calls use this org. |
DEFAULT_REPO_FILTER | ❌ No | Comma-separated list of repos to monitor (e.g., my-app,my-api). See precedence rules below. |
GITHUB_API_URL | ❌ No | Custom API URL (default: https://api.github.com) |
GITHUB_ENTERPRISE_SLUG | ❌ No | Enterprise slug for enhanced features |
GITHUB_ENTERPRISE_URL | ❌ No | GitHub Enterprise Server API URL |
DEVOPS_CONFIG_REPO | ❌ No | Config repo name (default: devops-config) |
DEVOPS_CONFIG_PATH | ❌ No | Local path to config files (for mounted configs) |
Repo Filter Precedence
When determining which repositories to query, ActionsPulse uses this precedence (highest to lowest):
| Priority | Source | Applies To | Example |
|---|---|---|---|
| 1️⃣ | repo_filter parameter in tool call | Individual tools | get_dora_metrics(repo_filter: "app1,app2") |
| 2️⃣ | inventory.yaml repositories | generate_devops_reports | Repos defined in config file |
| 3️⃣ | DEFAULT_REPO_FILTER env var | All tools (fallback) | DEFAULT_REPO_FILTER=my-app,my-api |
| 4️⃣ | All org repos via GitHub API | All tools | (default if nothing set) |
Tip: For quick setup without a config repo, just set DEFAULT_REPO_FILTER in the MCP Registry installer. For richer metadata (team, tier, compliance tags), use inventory.yaml.
4. Configuration Files (Optional)
By default, ActionsPulse queries ALL repositories in your organization via the GitHub API — no configuration files are required. You can filter repos dynamically using tool parameters like repo_filter.
The optional configuration files let you define persistent metadata (teams, tiers, compliance tags) for filtering and reporting. There are two approaches:
Option A: Remote Config Repository (Recommended for Teams)
Create a devops-config repository in your organization with the following structure:
devops-config/
├── devops-config.yaml          # Main configuration
├── repositories/
│   └── inventory.yaml          # List of repos to monitor
├── policies/
│   ├── workflow-policies.yaml  # CI/CD standards
│   └── security-policies.yaml  # Security requirements
└── dashboards/                 # Dashboard configs
The MCP server will automatically discover and load from {org}/devops-config repo.
Option B: Local Config Files (For Development/Testing)
Mount a local config directory into the Docker container:
📄 mcp.json with config volume
{
  "servers": {
    "actions-pulse": {
      "command": "docker",
      "args": [
        "run", "-i", "--rm",
        "--env-file", "/path/to/.mcp.env",
        "-e", "GITHUB_ORG=your-org-name",
        "-e", "DEVOPS_CONFIG_PATH=/app/config",
        "-v", "/path/to/your/config:/app/config:ro",
        "ghcr.io/tsviz/actions-pulse:latest"
      ],
      "type": "stdio"
    }
  }
}
Repository Inventory Example
📄 inventory.yaml
Create repositories/inventory.yaml to define which repos to monitor:
apiVersion: actions-pulse/v1
kind: RepositoryInventory
metadata:
  name: my-inventory
  version: "1.0.0"
  description: "Repositories to monitor"

spec:
  discovery:
    enabled: false  # Only monitor explicit repos

  repositories:
    - name: my-app
      team: platform
      tier: tier-1
      compliance: [SOC2]
      tags: [java, production]

    - name: my-api
      team: backend
      tier: tier-2
      tags: [nodejs, staging]
Repository Tiers Quick Reference
| Tier | Priority | Uptime | Response Time | Use Case |
|---|---|---|---|---|
| tier-1 | 🔴 Critical | 99.9% | < 15 min | Production, customer-facing |
| tier-2 | 🟡 Standard | 99% | < 1 hour | Internal tools, staging |
| tier-3 | 🟢 Low | Best effort | < 24 hours | Demos, prototypes |
See docs/ARCHITECTURE.md for complete tier definitions, compliance requirements, and alerting behavior.
5. Restart VS Code
After updating mcp.json, restart VS Code to pick up the new MCP server. You can verify the server is running by opening GitHub Copilot Chat and asking about your DevOps metrics.
🛠️ Available Tools
📊 Usage & Performance Metrics
get_actions_usage_metrics
Analyze GitHub Actions usage and billing data (basic).
Parameters:
- org_name: Organization name (optional if GITHUB_ORG is set)
- timeframe: '24h' | '7d' | '30d'
- breakdown: 'repository' | 'workflow' | 'runner_type'
get_detailed_usage_metrics ⭐
GitHub Insights-style detailed usage metrics with per-workflow, per-job, per-repo, per-OS, and per-runner breakdowns.
Parameters:
- org_name: Organization name (optional if GITHUB_ORG is set)
- timeframe: '7d' | '30d' | '90d'
- repo_filter: Comma-separated list of repositories (optional)
get_detailed_performance_metrics ⭐
GitHub Insights-style performance metrics with avg run time, queue time, and failure rates per workflow/job/repo/OS/runner.
Parameters:
- org_name: Organization name (optional if GITHUB_ORG is set)
- timeframe: '7d' | '30d' | '90d'
- repo_filter: Comma-separated list of repositories (optional)
get_actions_performance_metrics
Get workflow performance analytics with P95/P99 latencies (basic).
Parameters:
- org_name: Organization name (optional if GITHUB_ORG is set)
- repo_name: Specific repository (optional)
- workflow_id: Specific workflow (optional)
- timeframe: '1h' | '6h' | '24h' | '7d'
🏃 Runners & Cost Optimization
Enhanced Cost Detection: Reports now use a three-tier system for accurate runner cost calculation:
- 🎯 API Detection - Uses hosted runners API for exact machine specs
- 🏷️ Label Detection - Pattern matching against runner catalog
- 📊 Default Pricing - OS-based fallback
See Configuration Guide for details.
analyze_runner_utilization
Analyze runner utilization and efficiency.
Parameters:
- org_name: Organization name (optional if GITHUB_ORG is set)
- runner_type: 'self-hosted' | 'github-hosted' | 'all'
- include_costs: Include cost analysis (default: true)
get_actions_cache_analytics
Analyze Actions cache usage and efficiency.
Parameters:
- org_name: Organization name (optional if GITHUB_ORG is set)
- repo_name: Specific repository (optional)
- timeframe: '24h' | '7d' | '30d'
generate_cost_optimization_report
Generate actionable cost optimization recommendations.
Parameters:
- org_name: Organization name (optional if GITHUB_ORG is set)
- include_recommendations: Include actionable recommendations (default: true)
- target_savings_percentage: Target savings (5-50, default: 20)
🔍 Workflow Insights & Team Productivity
get_workflow_insights
Get workflow insights with bottleneck detection.
Parameters:
- org_name: Organization name (optional if GITHUB_ORG is set)
- repo_name: Repository name (required)
- workflow_name: Workflow name or filename (required)
- analyze_dependencies: Analyze job dependencies (default: true)
get_team_productivity_metrics
Analyze team productivity based on Actions and commit data.
Parameters:
- org_name: Organization name (optional if GITHUB_ORG is set)
- team_slug: Team slug (optional)
- include_individuals: Include individual metrics (default: false)
- timeframe: '7d' | '30d' | '90d'
get_compliance_audit_report
Generate compliance and security audit report.
Parameters:
- org_name: Organization name (optional if GITHUB_ORG is set)
- compliance_framework: 'SOC2' | 'ISO27001' | 'HIPAA' | 'PCI-DSS' | 'CUSTOM'
- include_secrets_scan: Include secret scanning (default: true, requires GHAS)
📊 DORA Metrics & Developer Experience
📈 DORA Metrics
get_dora_metrics
Get DORA metrics (Deployment Frequency, Lead Time, Change Failure Rate, Time to Restore).
Parameters:
- org_name: Organization name (optional if GITHUB_ORG is set)
- timeframe: '7d' | '30d' | '90d'
- repo_filter: Comma-separated list of repositories (optional)
get_enhanced_dora_metrics
DORA metrics using actual GitHub Deployments API for maximum accuracy.
Parameters:
- org_name: Organization name (optional if GITHUB_ORG is set)
- timeframe: '7d' | '30d' | '90d'
- repo_filter: Comma-separated list of repositories (optional)
get_pull_request_metrics
Pull request metrics including lead time, merge rates, and size distribution.
Parameters:
- org_name: Organization name (optional if GITHUB_ORG is set)
- timeframe: '7d' | '30d' | '90d'
- repo_name: Specific repository (optional)
- include_stale: Include stale PR analysis (optional)
get_issue_metrics
Issue metrics including time to close, label distribution, and backlog health.
Parameters:
- org_name: Organization name (optional if GITHUB_ORG is set)
- timeframe: '7d' | '30d' | '90d'
- repo_name: Specific repository (optional)
- label_filter: Filter by label (optional)
get_deployment_metrics
Deployment metrics from GitHub Deployments API.
Parameters:
- org_name: Organization name (optional if GITHUB_ORG is set)
- timeframe: '7d' | '30d' | '90d'
- environment: Filter by environment (optional)
- repo_filter: Comma-separated list of repositories (optional)
get_environment_metrics
Analyze GitHub environment configurations including protection rules.
Parameters:
- org_name: Organization name (optional if GITHUB_ORG is set)
- repo_filter: Comma-separated list of repositories (optional)
get_discussion_metrics
GitHub Discussions metrics including answer rates and engagement.
Parameters:
- org_name: Organization name (optional if GITHUB_ORG is set)
- repo_name: Specific repository (optional)
- timeframe: '7d' | '30d' | '90d'
get_merge_queue_metrics
Merge queue usage and adoption across repositories.
Parameters:
- org_name: Organization name (optional if GITHUB_ORG is set)
- repo_name: Specific repository (optional)
🏷️ Custom Properties
📋 Custom Properties Tools
get_org_custom_properties
List all custom property definitions for an organization.
Parameters:
- org_name: Organization name (optional if GITHUB_ORG is set)
get_custom_properties_analytics
Analyze custom property usage and coverage across repositories.
Parameters:
- org_name: Organization name (optional if GITHUB_ORG is set)
get_repos_by_property
Find repositories by custom property value.
Parameters:
- org_name: Organization name (optional if GITHUB_ORG is set)
- property_name: Custom property name (e.g., team, tier, compliance)
- property_value: Property value to filter by (optional)
🏢 Enterprise Features (Optional)
⚙️ Enterprise configuration
If you have GitHub Enterprise, you can enable enhanced features by adding:
GITHUB_ENTERPRISE_SLUG=your-enterprise-slug
This enables:
- Cross-organization billing aggregation
- Enterprise-wide runner pools
- Consolidated audit logs
🔧 Development
🛠️ Build and run commands
Build locally
npm install
npm run build
docker build -t actions-pulse:local .
Run locally (without Docker)
export GITHUB_TOKEN=ghp_your_token
export GITHUB_ORG=your-org
npm start
📚 Documentation
| Document | Description |
|---|---|
| Quick Start | Get up and running in 5 minutes |
| Configuration Guide | Complete configuration reference |
| Architecture | System design and tier definitions |
Example Configurations
Ready-to-use configuration examples are available in the examples/ directory:
| File | Description |
|---|---|
| mcp-docker.json | VS Code MCP config using Docker |
| mcp-local.json | VS Code MCP config for local development |
| mcp-envfile.json | VS Code MCP config using environment file |
| .env.example | Environment variables template |
| inventory.yaml | Repository inventory example |
| devops-config.yaml | DevOps observer configuration |
| docker-compose.yml | Docker Compose deployment |
�📄 License
MIT