MATLAB MCP Server
Give any AI agent the power of MATLAB — via the Model Context Protocol
Quick Start • Examples • Tools Reference • Configuration • Wiki
![]()


![]()

A Python MCP server that connects any AI agent (Claude, Cursor, Copilot, custom agents) to a shared MATLAB installation. Execute code, discover toolboxes, check code quality, get interactive Plotly plots, and run long simulations — all through MCP.
Why?
- Your AI agent can now write and run MATLAB code directly
- Long-running jobs (hours!) run async — the agent keeps working while MATLAB computes
- Multiple users share one MATLAB server via an elastic engine pool
- Interactive plots come back as Plotly JSON — renderable in any web UI
- Custom MATLAB libraries become first-class AI tools with zero code changes
Features
| Feature | Description |
|---|---|
| Execute MATLAB code | Sync for fast commands, auto-async for long jobs |
| Elastic engine pool | Scales 2-10+ engines based on demand |
| Toolbox discovery | Browse installed toolboxes, functions, help text |
| Code checker | Run checkcode/mlint before execution |
| Interactive plots | Figures auto-converted to Plotly JSON |
| Multi-user (SSE) | Session isolation with per-user workspaces |
| Custom tools | Expose your .m functions as MCP tools via YAML |
| Progress reporting | Long jobs report percentage back to the agent |
| Cross-platform | Windows + macOS, MATLAB R2022b+ |
| One-click Windows install | Offline install.bat — no admin rights needed |
MATLAB Plot Conversion to Interactive Plotly
Every MATLAB figure is automatically converted into an interactive Plotly chart — no extra code needed. When your MATLAB code creates a plot, the server:
- Extracts figure properties via
mcp_extract_props.m— axes, line data, labels, colors, markers, legends, subplots - Maps MATLAB styles to Plotly — line styles (
--→dash), markers (o→circle), legend positions, axis scales, colormaps - Returns interactive JSON — renderable in any web UI with
Plotly.newPlot() - Generates a static PNG + thumbnail as fallback for non-interactive clients
Supported plot types: line, scatter, bar, area, subplots (subplot/tiledlayout), multiple axes, log/linear scales
Style fidelity: Line styles, marker shapes, colors (RGB), line widths, font sizes, axis labels, titles, legends, grid lines, axis limits, and background colors are all preserved.
% This MATLAB code...
x = linspace(0, 2*pi, 200);
plot(x, sin(x), 'r-', 'LineWidth', 2); hold on;
plot(x, cos(x), 'b--', 'LineWidth', 2);
plot(x, sin(x) .* cos(x), 'g-.', 'LineWidth', 2);
legend('sin(x)', 'cos(x)', 'sin(x)*cos(x)');
xlabel('x'); ylabel('y');
title('Trigonometric Functions');
...automatically becomes this interactive Plotly chart:
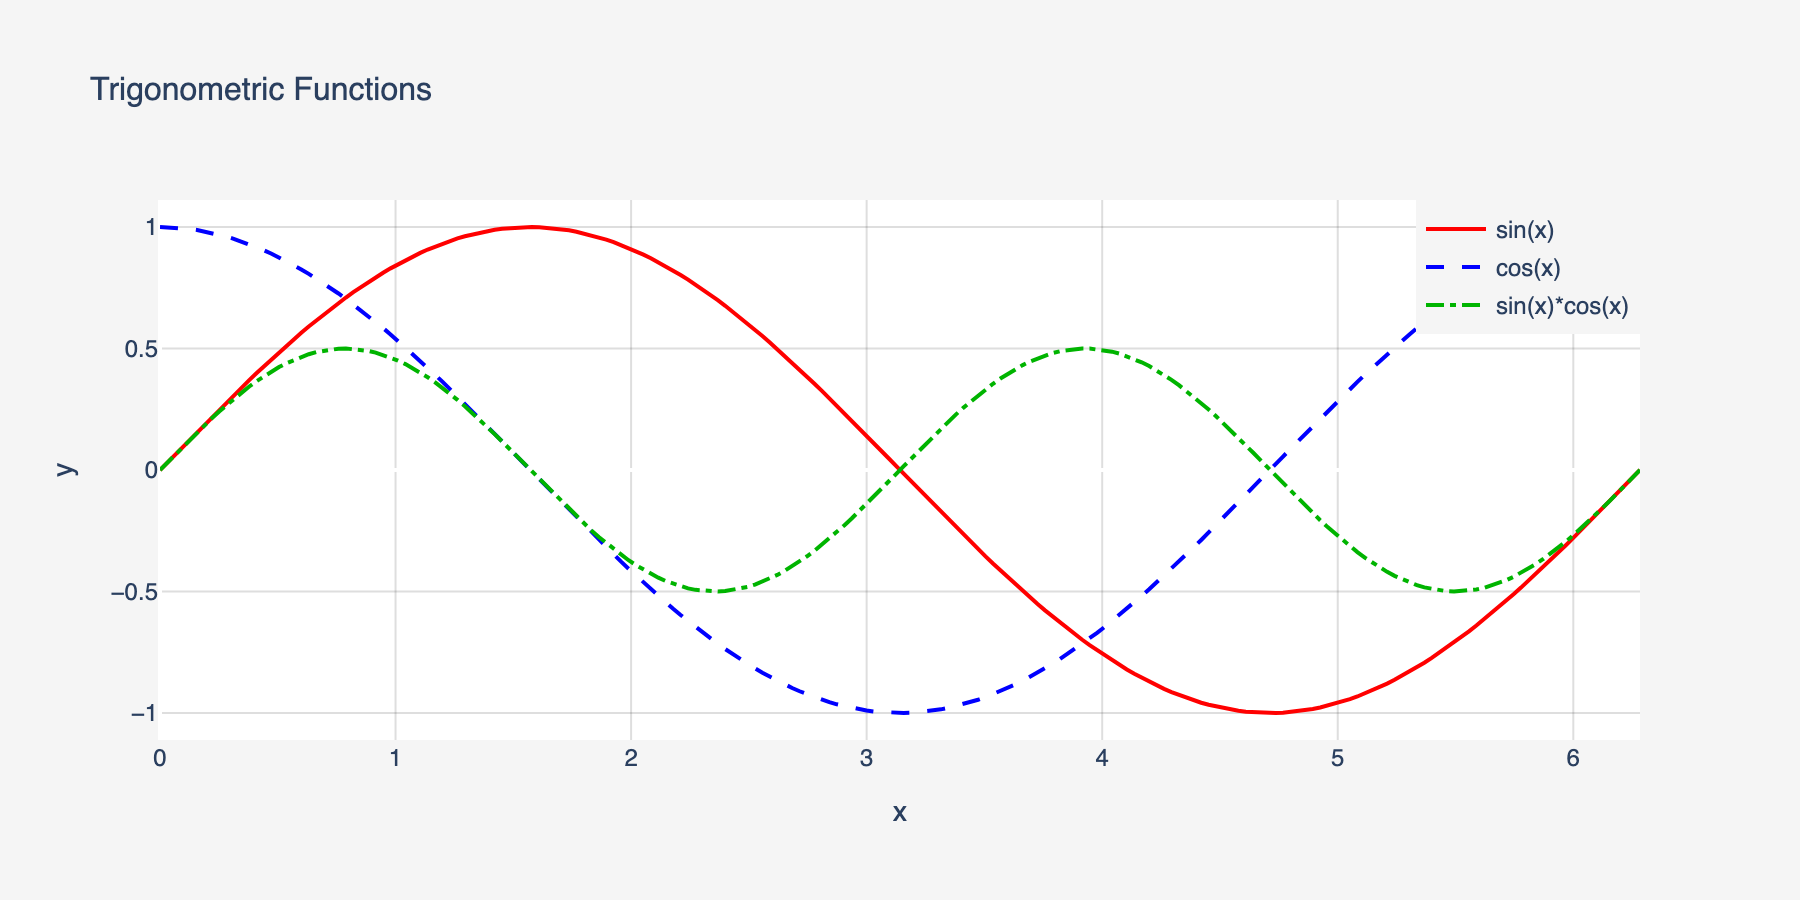
Line styles, colors, markers, legends, and axis labels are all preserved in the conversion.
Quick Start
Prerequisites
- Python 3.10+
- MATLAB R2022b+ with the MATLAB Engine API for Python installed
# Install MATLAB Engine API (from your MATLAB installation)
cd /Applications/MATLAB_R2024a.app/extern/engines/python  # macOS
# cd "C:\Program Files\MATLAB\R2024a\extern\engines\python"  # Windows
pip install .
Install the server
Windows (one-click, no admin needed):
git clone https://github.com/HanSur94/matlab-mcp-server-python.git
cd matlab-mcp-server-python
install.bat
The installer auto-detects MATLAB, creates a virtual environment, and installs everything from bundled wheels — fully offline, no internet required. Works on Windows 10/11 with Python 3.10, 3.11, or 3.12.
macOS / Linux:
# Option 1: Install from PyPI
pip install matlab-mcp-python

# Option 2: Install from source
git clone https://github.com/HanSur94/matlab-mcp-server-python.git
cd matlab-mcp-server-python
pip install -e ".[dev]"
Run it
# Single user (stdio) — simplest setup
matlab-mcp

# Multi-user (SSE) — shared server
matlab-mcp --transport sse
Connect to Claude Desktop
Add to your Claude Desktop config (~/Library/Application Support/Claude/claude_desktop_config.json on macOS):
{
  "mcpServers": {
    "matlab": {
      "command": "matlab-mcp"
    }
  }
}
Connect to Claude Code
claude mcp add matlab -- matlab-mcp
Connect to Cursor
Add to .cursor/mcp.json in your project:
{
  "mcpServers": {
    "matlab": {
      "command": "matlab-mcp"
    }
  }
}
Run with Docker
# Build the image
docker build -t matlab-mcp .

# Run with your MATLAB mounted
docker run -p 8765:8765 -p 8766:8766 \
  -v /path/to/MATLAB:/opt/matlab:ro \
  -e MATLAB_MCP_POOL_MATLAB_ROOT=/opt/matlab \
  matlab-mcp

# Or use docker-compose (edit docker-compose.yml to set your MATLAB path)
docker compose up
Note: The Docker image does not include MATLAB. You must mount your own MATLAB installation.
Upgrading? If you previously installed as
matlab-mcp-server, uninstall first:pip uninstall matlab-mcp-server && pip install matlab-mcp-python
Examples
Basic: Run MATLAB Code
Ask your AI agent:
"Calculate the eigenvalues of a 3x3 magic square in MATLAB"
The agent calls execute_code:
A = magic(3);
eigenvalues = eig(A);
disp(eigenvalues)
Result returned inline:
15.0000
 4.8990
-4.8990
Signal Processing
"Generate a 1kHz sine wave, add noise, then filter it with a low-pass Butterworth filter and plot both"
fs = 8000;
t = 0:1/fs:0.1;
clean = sin(2*pi*1000*t);
noisy = clean + 0.5*randn(size(t));

[b, a] = butter(6, 1500/(fs/2));
filtered = filter(b, a, noisy);

subplot(2,1,1); plot(t, noisy); title('Noisy Signal');
subplot(2,1,2); plot(t, filtered); title('Filtered Signal');
Returns: Interactive Plotly chart + static PNG + thumbnail.
Long-Running Simulation (Async)
"Run a Monte Carlo simulation with 1 million trials"
n = 1e6;
results = zeros(n, 1);
for i = 1:n
    results(i) = simulate_trial();  % your custom function
    if mod(i, 1e5) == 0
        mcp_progress(__mcp_job_id__, i/n*100, sprintf('Trial %d/%d', i, n));
    end
end
disp(mean(results));
The agent gets a job ID immediately, polls progress ("Trial 500000/1000000 — 50%"), and retrieves results when done.
Custom Tools
Expose your proprietary MATLAB functions as first-class AI tools. Create custom_tools.yaml:
tools:
  - name: analyze_signal
    matlab_function: mylib.analyze_signal
    description: "Analyze a signal and return frequency components, SNR, and peak detection"
    parameters:
      - name: signal_path
        type: string
        required: true
      - name: sample_rate
        type: float
        required: true
      - name: window_size
        type: int
        default: 1024
    returns: "Struct with fields: frequencies, magnitudes, snr, peaks"

  - name: train_model
    matlab_function: ml.train_classifier
    description: "Train a classification model on the given dataset"
    parameters:
      - name: dataset_path
        type: string
        required: true
      - name: model_type
        type: string
        default: "svm"
    returns: "Trained model object saved to workspace"
Now the agent can call analyze_signal or train_model directly — with full parameter validation and help text.
MCP Tools Reference
Code Execution
| Tool | Parameters | Description |
|---|---|---|
execute_code | code: str | Run MATLAB code. Returns inline if fast (<30s), or a job ID if promoted to async |
check_code | code: str | Run checkcode/mlint. Returns structured warnings/errors |
get_workspace | — | Show variables in the current MATLAB workspace |
Async Job Management
| Tool | Parameters | Description |
|---|---|---|
get_job_status | job_id: str | Status + progress percentage for running jobs |
get_job_result | job_id: str | Full result of a completed job |
cancel_job | job_id: str | Cancel a pending or running job |
list_jobs | — | List all jobs in this session |
Discovery
| Tool | Parameters | Description |
|---|---|---|
list_toolboxes | — | List installed MATLAB toolboxes |
list_functions | toolbox_name: str | List functions in a toolbox |
get_help | function_name: str | Get MATLAB help text for any function |
File Management
| Tool | Parameters | Description |
|---|---|---|
upload_data | filename: str, content_base64: str | Upload data files to the session |
delete_file | filename: str | Delete a session file |
list_files | — | List files in the session directory |
File Reading
| Tool | Parameters | Description |
|---|---|---|
read_script | filename: str | Read a MATLAB .m script file as text |
read_data | filename: str, format: str | Read data files (.mat, .csv, .json, .txt, .xlsx). format: summary or raw |
read_image | filename: str | Read image files (.png, .jpg, .gif) — renders inline in agent UIs |
Admin
| Tool | Parameters | Description |
|---|---|---|
get_pool_status | — | Engine pool stats (available/busy/max) |
Monitoring
| Tool | Parameters | Description |
|---|---|---|
get_server_metrics | — | Comprehensive server metrics (pool, jobs, sessions, system) |
get_server_health | — | Health status with issue detection (healthy/degraded/unhealthy) |
get_error_log | limit: int | Recent errors and notable events |
Configuration
All settings live in config.yaml with sensible defaults. Override any setting via environment variables:
# Override pool size
export MATLAB_MCP_POOL_MIN_ENGINES=4
export MATLAB_MCP_POOL_MAX_ENGINES=16

# Override sync timeout (promote to async after 60s instead of 30s)
export MATLAB_MCP_EXECUTION_SYNC_TIMEOUT=60

# Override transport
export MATLAB_MCP_SERVER_TRANSPORT=sse
Key Configuration Sections
Server — transport, host, port, logging
server:
  name: "matlab-mcp-server"
  transport: "stdio"        # stdio | sse
  host: "0.0.0.0"           # SSE only
  port: 8765                # SSE only
  log_level: "info"         # debug | info | warning | error
  log_file: "./logs/server.log"
  result_dir: "./results"
  drain_timeout_seconds: 300
Pool — engine count, scaling, health checks
pool:
  min_engines: 2            # always warm
  max_engines: 10           # hard ceiling
  scale_down_idle_timeout: 900   # 15 min
  engine_start_timeout: 120
  health_check_interval: 60
  proactive_warmup_threshold: 0.8
  queue_max_size: 50
  matlab_root: null         # auto-detect
Execution — timeouts, workspace isolation
execution:
  sync_timeout: 30          # seconds before async promotion
  max_execution_time: 86400 # 24h hard limit
  workspace_isolation: true
  engine_affinity: false    # pin session to engine
  temp_dir: "./temp"
  temp_cleanup_on_disconnect: true
Security — function blocklist, upload limits
security:
  blocked_functions_enabled: true
  blocked_functions:
    - "system"
    - "unix"
    - "dos"
    - "!"
    - "eval"
    - "feval"
    - "evalc"
    - "evalin"
    - "assignin"
    - "perl"
    - "python"
  max_upload_size_mb: 100
  require_proxy_auth: false
Toolboxes — whitelist/blacklist exposure
toolboxes:
  mode: "whitelist"         # whitelist | blacklist | all
  list:
    - "Signal Processing Toolbox"
    - "Optimization Toolbox"
    - "Statistics and Machine Learning Toolbox"
    - "Image Processing Toolbox"
Output — Plotly, images, thumbnails
output:
  plotly_conversion: true
  static_image_format: "png"
  static_image_dpi: 150
  thumbnail_enabled: true
  thumbnail_max_width: 400
  large_result_threshold: 10000
  max_inline_text_length: 50000
Monitoring
Built-in observability with a web dashboard, JSON health/metrics endpoints, and MCP tools for AI agent self-monitoring.
Dashboard
Access at http://localhost:8766/dashboard (stdio) or http://localhost:8765/dashboard (SSE).
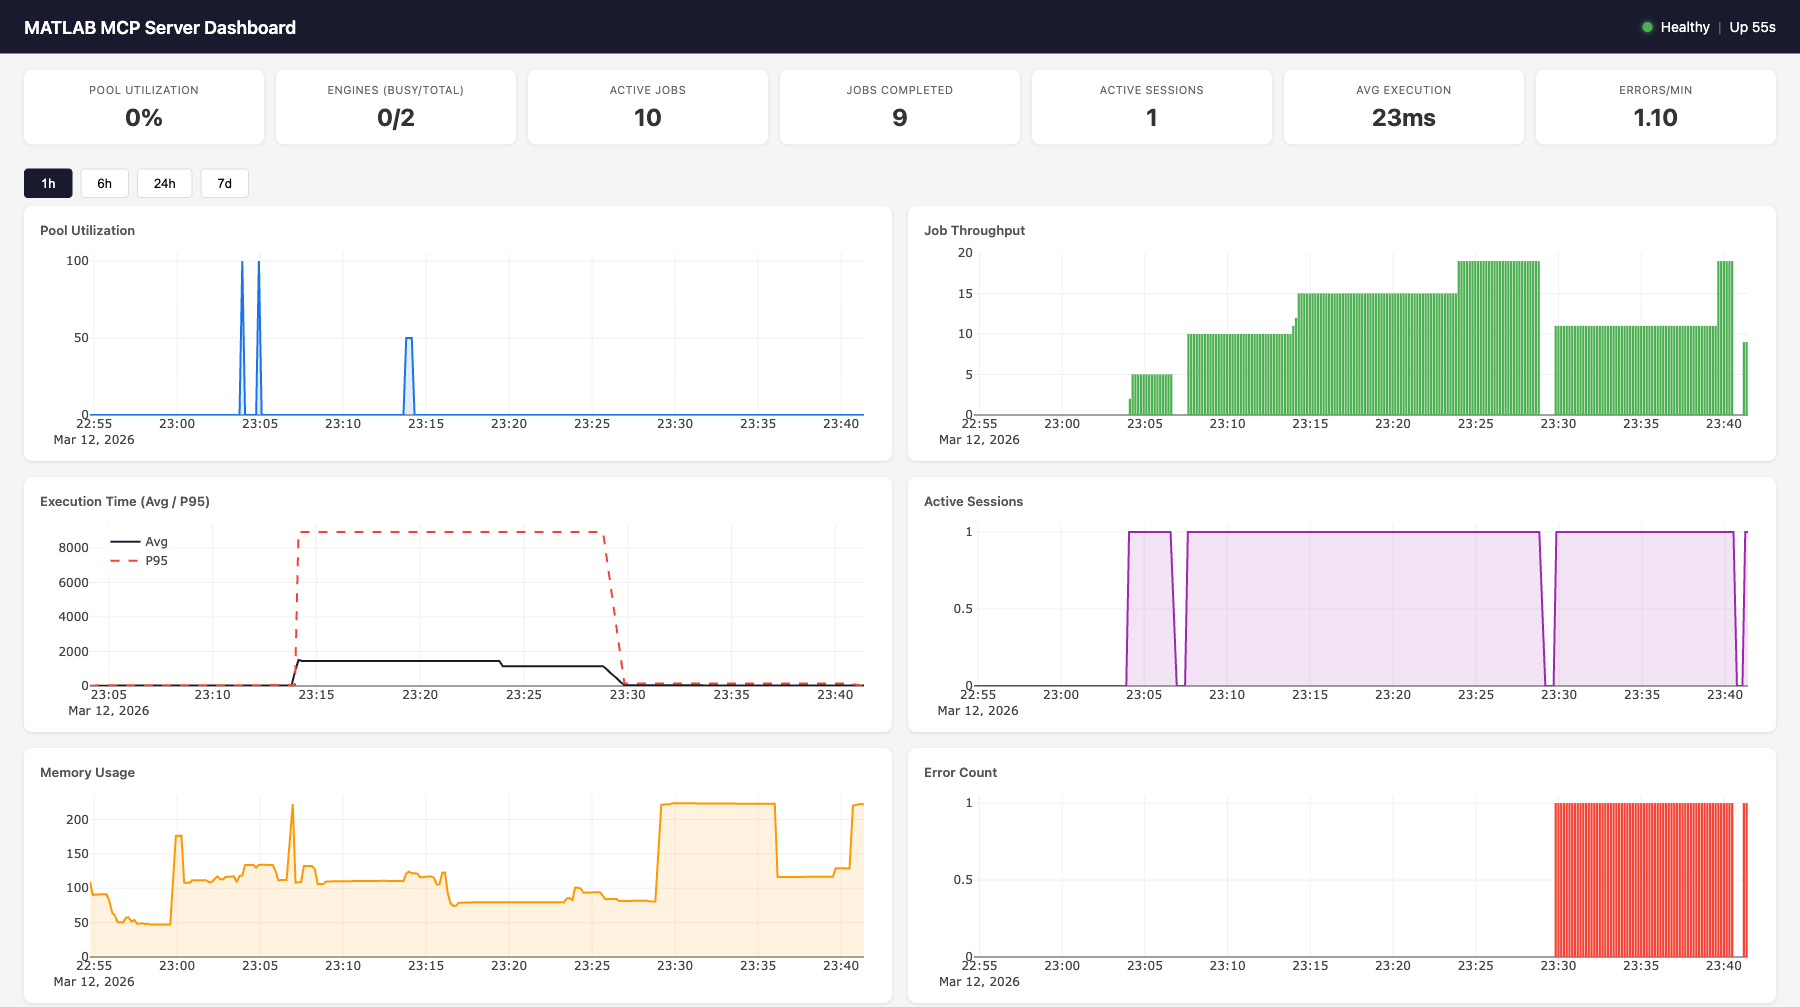
Features:
- 7 live gauges: pool utilization, engines (busy/total), active jobs, completed jobs, active sessions, avg execution time, errors/min
- 6 time-series charts (Plotly.js): pool utilization, job throughput, execution time (avg + p95), active sessions, memory usage, error count
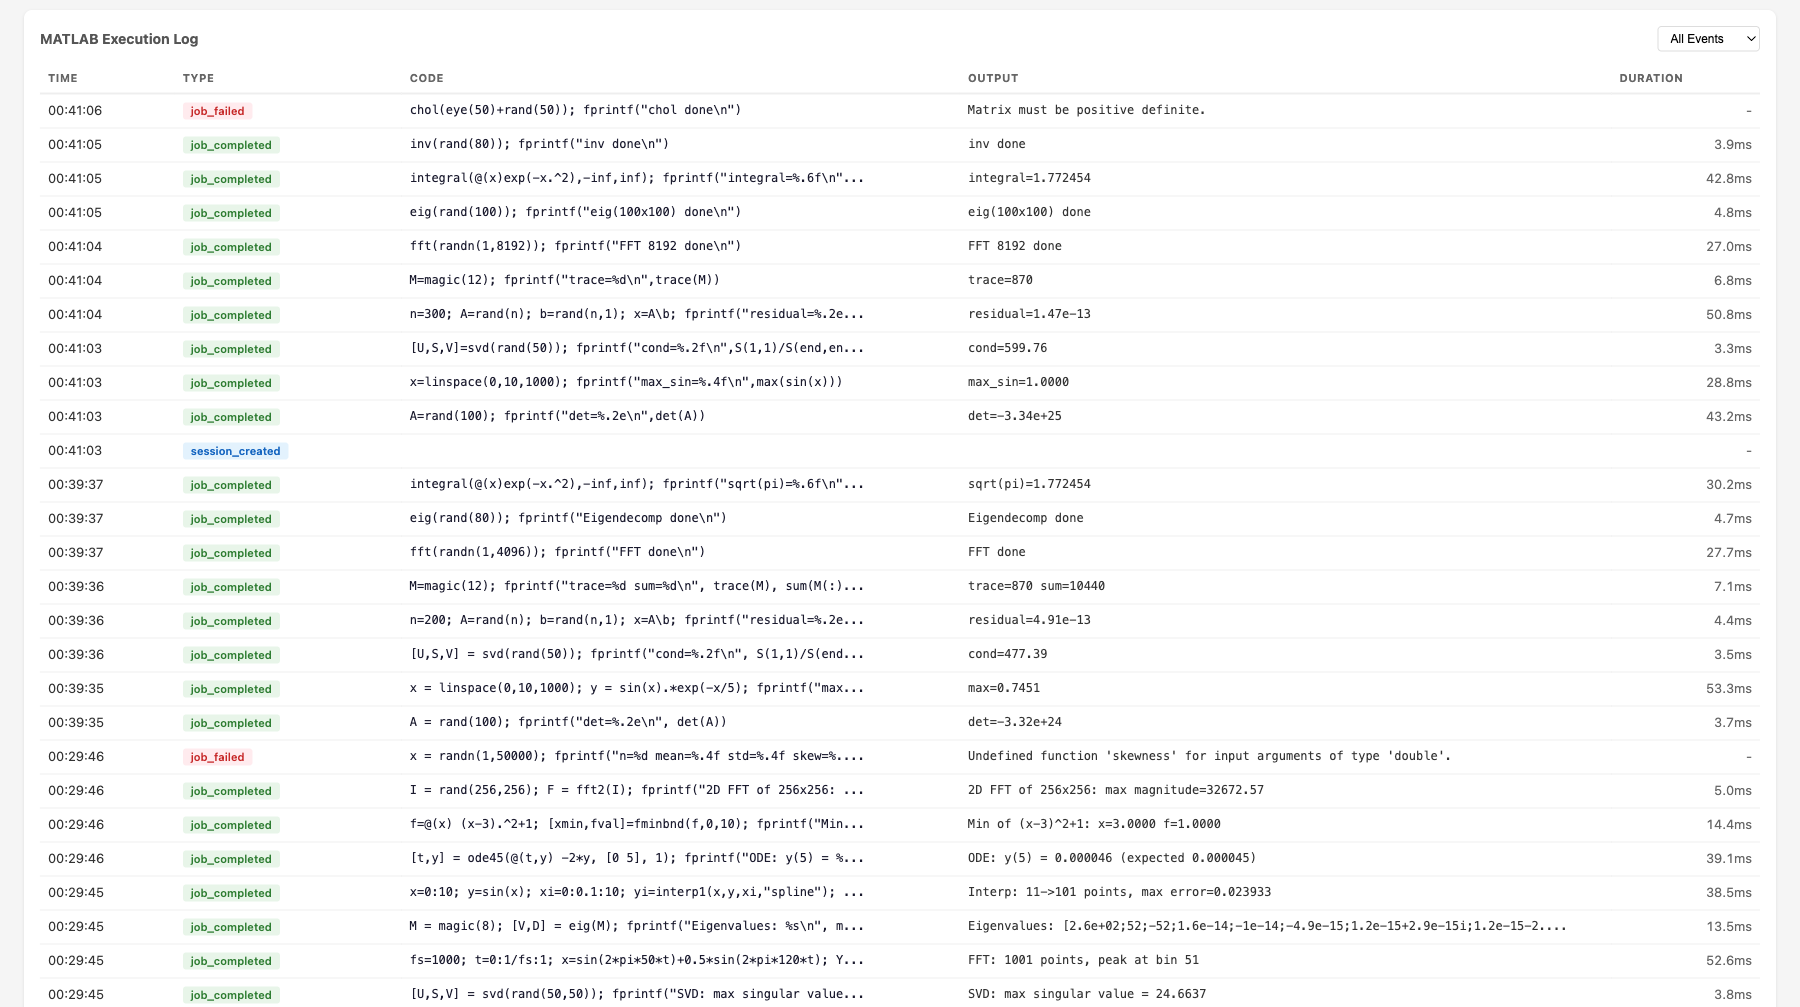
- MATLAB execution log: filterable table showing time, event type, MATLAB code, output, and duration for every job
- Time range selector: 1h, 6h, 24h, 7d views
- Auto-refreshes every 10 seconds
Health Endpoint
curl http://localhost:8766/health
{
  "status": "healthy",
  "uptime_seconds": 3600.1,
  "issues": [],
  "engines": {"total": 2, "available": 1, "busy": 1},
  "active_jobs": 1,
  "active_sessions": 3
}
Status codes: 200 for healthy/degraded, 503 for unhealthy.
Health evaluation rules:
| Status | Condition |
|---|---|
unhealthy | No engines running (total == 0) |
unhealthy | All engines busy at max capacity (available == 0 && total >= max_engines) |
degraded | Pool utilization > 90% |
degraded | Health check failures detected |
degraded | Error rate > 5/min |
healthy | None of the above |
Metrics Endpoint
curl http://localhost:8766/metrics
{
  "timestamp": "2026-03-12T23:01:56.799Z",
  "pool": {"total": 2, "available": 1, "busy": 1, "max": 10, "utilization_pct": 50.0},
  "jobs": {"active": 1, "completed_total": 47, "failed_total": 2, "cancelled_total": 0, "avg_execution_ms": 28.5},
  "sessions": {"total_created": 5, "active": 3},
  "errors": {"total": 2, "blocked_attempts": 0, "health_check_failures": 0},
  "system": {"uptime_seconds": 3600.1, "memory_mb": 108.8, "cpu_percent": 12.3}
}
Dashboard API
| Endpoint | Parameters | Description |
|---|---|---|
GET /health | — | Health status + issues |
GET /metrics | — | Live metrics snapshot (no DB hit) |
GET /dashboard | — | Web dashboard HTML |
GET /dashboard/api/current | — | Same as /metrics |
GET /dashboard/api/history | metric, hours | Time-series data from SQLite |
GET /dashboard/api/events | limit, type | Event log with MATLAB output |
Available history metrics: pool.utilization_pct, pool.total_engines, pool.busy_engines, jobs.completed_total, jobs.failed_total, jobs.avg_execution_ms, jobs.p95_execution_ms, sessions.active_count, system.memory_mb, system.cpu_percent, errors.total
Backend Architecture
                    ┌─────────────────────────────────────────────┐
                    │           MetricsCollector                   │
                    │                                             │
                    │  In-memory:                                 │
  record_event() ──│─▶ _counters (7 counters)                    │
  (sync, from any  │   _execution_times (ring buffer, maxlen=100)│
   component)      │                                             │
                    │  Background task (every 10s):               │
                    │   sample_once() ─▶ MetricsStore.insert()   │
                    │                                             │
                    │  Live snapshot (no DB):                     │
                    │   get_current_snapshot() ─▶ /metrics        │
                    └───────────┬─────────────────────────────────┘
                                │
                    ┌───────────▼─────────────────────────────────┐
                    │           MetricsStore (aiosqlite)           │
                    │                                             │
                    │  metrics table:                             │
                    │   id | timestamp | category | metric | value│
                    │   (4 indexes for fast queries)              │
                    │                                             │
                    │  events table:                              │
                    │   id | timestamp | event_type | details     │
                    │   (details = JSON with code, output, etc.)  │
                    │                                             │
                    │  Methods:                                   │
                    │   insert_metrics(), insert_event()          │
                    │   get_latest(), get_history(), get_events() │
                    │   get_aggregates(), prune()                 │
                    │                                             │
                    │  SQLite WAL mode, log-and-swallow errors    │
                    └───────────┬─────────────────────────────────┘
                                │
                    ┌───────────▼─────────────────────────────────┐
                    │     Starlette Dashboard App                  │
                    │                                             │
                    │  /health ─▶ evaluate_health(collector)      │
                    │  /metrics ─▶ collector.get_current_snapshot()│
                    │  /dashboard ─▶ cached index.html            │
                    │  /dashboard/api/* ─▶ store queries          │
                    │  /dashboard/static/* ─▶ JS, CSS, Plotly.js  │
                    └─────────────────────────────────────────────┘
Event Types
Events are recorded synchronously via collector.record_event() from any server component. Each event includes a JSON details field.
| Event Type | Source | Details Fields |
|---|---|---|
job_completed | Executor | job_id, execution_ms, code, output |
job_failed | Executor | job_id, code, error |
session_created | SessionManager | session_id_short |
engine_scale_up | PoolManager | engine_id, total_after |
engine_scale_down | PoolManager | engine_id, total_after |
engine_replaced | PoolManager | old_id, new_id |
health_check_fail | PoolManager | engine_id, error |
blocked_function | SecurityValidator | function, code_snippet |
In-Memory Counters
The collector maintains 7 counters updated on every event (no DB hit):
| Counter | Incremented By |
|---|---|
completed_total | job_completed |
failed_total | job_failed |
cancelled_total | job_cancelled |
total_created_sessions | session_created |
error_total | Any error event (job_failed, blocked_function, engine_crash, health_check_fail) |
blocked_attempts | blocked_function |
health_check_failures | health_check_fail |
Execution Time Tracking
Job execution times are stored in a ring buffer (deque(maxlen=100)) for O(1) avg/p95 calculation without DB queries. The p95 is computed as sorted_times[int((len-1) * 0.95)].
Transport Integration
| Transport | Monitoring Port | How |
|---|---|---|
| SSE | Same as SSE port (8765) | Dashboard mounted as Starlette sub-app via mcp._additional_http_routes |
| stdio | Separate port (8766) | Uvicorn started as background asyncio.Task |
Data Retention
The cleanup loop runs every 60 seconds and calls store.prune(retention_days=7) to delete metrics and events older than the configured retention period. SQLite WAL mode ensures reads aren't blocked during writes.
Configuration
monitoring:
  enabled: true
  sample_interval: 10      # seconds between metric samples
  retention_days: 7         # days to keep historical data
  db_path: "./monitoring/metrics.db"
  dashboard_enabled: true
  http_port: 8766           # dashboard/health port (stdio only)
Environment overrides: MATLAB_MCP_MONITORING_ENABLED, MATLAB_MCP_MONITORING_SAMPLE_INTERVAL, etc.
Architecture
AI Agent (Claude, Cursor, etc.)
       │
       │ MCP Protocol (stdio or SSE)
       ▼
┌──────────────────────────────────────────────────────────┐
│   MCP Server (FastMCP 2.x)                                │
│   20 tools + custom tools                                 │
│   Session manager  │  Security validator  │  Formatter    │
└──────────┬───────────────────────────────┬───────────────┘
           │                               │
┌──────────▼──────────────────┐  ┌─────────▼──────────────┐
│   Job Executor               │  │  MetricsCollector       │
│   Sync/async execution       │  │  In-memory counters     │
│   Timeout auto-promotion     │  │  Ring buffer (p95)      │
│   stdout/stderr capture      │  │  Background sampling    │
│   Event recording ──────────────▶  Event recording       │
└──────────┬──────────────────┘  └─────────┬──────────────┘
           │                               │
┌──────────▼──────────────────┐  ┌─────────▼──────────────┐
│   MATLAB Pool Manager        │  │  MetricsStore (SQLite)  │
│   Elastic engine pool        │  │  Time-series metrics    │
│   Scale up/down on demand    │  │  Event log with output  │
│   Health checks & replace    │  │  Aggregates & history   │
└──────────┬──────────────────┘  └─────────┬──────────────┘
           │                               │
┌──────────▼──────────────────┐  ┌─────────▼──────────────┐
│   MATLAB Engines (R2022b+)    │  │  Dashboard (Starlette)  │
│   Engine 1 │ Engine 2 │ ... │  │  /health  /metrics      │
│   Workspace isolation        │  │  /dashboard (Plotly.js) │
└──────────────────────────────┘  └─────────────────────────┘
Request Flow
- AI agent sends
execute_codevia MCP protocol SecurityValidatorchecks code against function blocklistJobExecutorcreates a job, acquires an engine from the pool- Code runs in MATLAB with stdout/stderr captured via
StringIO - If completes within
sync_timeout(30s): result returned inline - If exceeds timeout: promoted to async, agent gets
job_idto poll MetricsCollector.record_event()logs code + output + duration- Engine released back to pool, workspace reset
Component Wiring
All components receive a collector reference at construction time. The collector is wired to live pool/tracker/sessions in the lifespan handler after startup. This allows synchronous record_event() calls from any component without async overhead.
# Construction (before event loop)
collector = MetricsCollector(config)
pool = EnginePoolManager(config, collector=collector)
executor = JobExecutor(pool, tracker, config, collector=collector)
sessions = SessionManager(config, collector=collector)
security = SecurityValidator(config.security, collector=collector)

# Lifespan (after event loop starts)
collector.pool = pool
collector.tracker = tracker
collector.sessions = sessions
collector.store = MetricsStore(config.monitoring.db_path)
Development
# Install dev dependencies
pip install -e ".[dev]"

# Run tests (no MATLAB needed — uses mock engine)
pytest tests/ -v

# Run with coverage
pytest tests/ --cov=matlab_mcp --cov-report=term-missing

# Lint
ruff check src/ tests/
Project Structure
src/matlab_mcp/
├── server.py          # MCP server entry point, tool registration
├── config.py          # YAML config, pydantic validation, env overrides
├── pool/
│   ├── engine.py      # Single MATLAB engine wrapper
│   └── manager.py     # Elastic pool manager
├── jobs/
│   ├── models.py      # Job data model, lifecycle
│   ├── tracker.py     # Job store, pruning
│   └── executor.py    # Sync/async execution, timeout promotion
├── tools/
│   ├── core.py        # execute_code, check_code, get_workspace
│   ├── discovery.py   # list_toolboxes, list_functions, get_help
│   ├── jobs.py        # job status, result, cancel, list
│   ├── files.py       # upload, delete, list files
│   ├── admin.py       # pool status
│   ├── monitoring.py  # get_server_metrics, get_server_health, get_error_log
│   └── custom.py      # Custom tool loader from YAML
├── monitoring/
│   ├── collector.py   # Background metrics sampling, event recording
│   ├── store.py       # Async SQLite storage for time-series data
│   ├── health.py      # Health evaluation (healthy/degraded/unhealthy)
│   ├── routes.py      # HTTP route handlers (/health, /metrics)
│   ├── dashboard.py   # Starlette sub-app with dashboard API
│   └── static/        # Dashboard HTML, CSS, JS (Plotly.js)
├── output/
│   ├── formatter.py   # Result formatting
│   ├── plotly_convert.py       # Load Plotly JSON from MATLAB extraction
│   ├── plotly_style_mapper.py  # MATLAB→Plotly style/property conversion
│   └── thumbnail.py
├── session/
│   └── manager.py     # Session lifecycle, temp dirs
├── security/
│   └── validator.py   # Function blocklist, filename sanitization
└── matlab_helpers/
    ├── mcp_extract_props.m
    ├── mcp_checkcode.m
    └── mcp_progress.m
Security
| Protection | Description |
|---|---|
| Function blocklist | Blocks system(), unix(), dos(), !, eval(), feval(), evalc(), evalin(), assignin(), perl(), python() by default |
| Filename sanitization | Rejects filenames with path traversal or invalid characters |
| Workspace isolation | clear all; clear global; clear functions; fclose all; restoredefaultpath; between sessions |
| SSE proxy auth | Requires reverse proxy with auth for production |
| Upload size limits | Configurable max upload size (default 100MB) |
License
Contributing
Contributions welcome! Please open an issue or PR on GitHub.