ML Research MCP
A comprehensive Model Context Protocol (MCP) server providing research productivity tools for machine learning researchers and developers.
Overview
ML Research MCP is an extensible platform that provides AI assistants with powerful tools for scientific research workflows. Built on the Model Context Protocol, it enables seamless integration with AI applications like Claude Desktop to automate and enhance various research tasks.
Current Status: Phase 1 - Data Visualization Roadmap: Image generation, presentation tools, literature management, and more
Vision & Roadmap
This project aims to be a comprehensive research assistant covering the entire ML research lifecycle:
✅ Phase 1: Data Visualization (Current)
- Scientific plotting with publication-quality output
- Statistical analysis visualizations
- 2D data representations (heatmaps, contours)
- Multiple export formats (PNG, PDF, SVG)
🚧 Phase 2: Image & Figure Generation (Planned)
- AI-powered figure generation using diffusion models
- Diagram creation for architecture illustrations
- Chart enhancement with intelligent styling
- Multi-panel figure composition
🚧 Phase 3: Presentation Tools (Planned)
- Slide generation from research content
- Poster creation for conferences
- Automated layout optimization
- Template management for institutional branding
🚧 Phase 4: Research Management (Future)
- Literature search and summarization
- Citation management and formatting
- Experiment tracking and versioning
- Collaboration tools for team projects
Current Features (Phase 1)
Data Visualization Tools
Basic Plots
plot_line- Time series and continuous data visualizationplot_scatter- Multi-dimensional scatter plots with size/color mappingplot_bar- Categorical comparisons (vertical/horizontal)
Statistical Visualizations
plot_histogram- Distribution analysis with density estimationplot_box- Statistical summaries and outlier detectionplot_violin- Detailed distribution shapes with KDE
2D Representations
plot_heatmap- Matrix visualization with annotationsplot_contour- 3D data in 2D with contour linesplot_pcolormesh- Fast pseudocolor plots for large datasets
Technical Highlights
- Publication-quality output via UltraPlot
- High-performance data handling with Polars
- Flexible input from CSV, JSON files or direct data
- Vector & raster formats (PDF, SVG, PNG)
- Type-safe with comprehensive validation
- Well-tested with 48 passing tests
Requirements
- Python 3.12+
- uv package manager
- MCP-compatible client (Claude Desktop, VSCode, etc.)
Installation
Quick Start with Claude Code
Add the server to Claude Code with a single command:
claude mcp add-json "ml-research" \
  '{"command":"uvx","args":["--from","git+https://github.com/nishide-dev/ml-research-mcp","ml-research-mcp"]}'
Verify installation:
claude mcp list
Manual Installation for MCP Clients
Add to your MCP client configuration (e.g., ~/Library/Application Support/Claude/claude_desktop_config.json):
{
  "mcpServers": {
    "ml-research": {
      "command": "uvx",
      "args": [
        "--from",
        "git+https://github.com/nishide-dev/ml-research-mcp",
        "ml-research-mcp"
      ]
    }
  }
}
Direct Execution with uvx
Run the server directly without installation:
# From GitHub (recommended)
uvx --from "git+https://github.com/nishide-dev/ml-research-mcp" ml-research-mcp

# From local directory (for development)
cd /path/to/ml-research-mcp
uvx --from . ml-research-mcp
For Developers
Clone and set up development environment:
git clone https://github.com/nishide-dev/ml-research-mcp.git
cd ml-research-mcp
uv sync

# Run in development mode
uv run ml-research-mcp
Quick Start
Using with Claude Desktop
After installation, you can ask Claude:
"Create a line plot showing temperature over time from experiment.csv"
"Generate a heatmap of the correlation matrix and save as PDF"
"Plot a scatter chart with x=[1,2,3,4], y=[2,4,6,8], sized by [10,20,30,40]"
Using as a Library
from ml_research_mcp.tools.plot_basic import plot_line

# Generate publication-quality plot
image = plot_line(
    x=[1, 2, 3, 4, 5],
    y=[1, 4, 9, 16, 25],
    style={"title": "Quadratic Function", "xlabel": "X", "ylabel": "Y²"},
    output={"format": "pdf", "width": 20, "height": 15, "dpi": 300}
)

# Save to file
with open("plot.pdf", "wb") as f:
    f.write(image)
Example Gallery
Real examples generated with ML Research MCP:
| Query | Result |
|---|---|
| Line Plot "Create a line plot showing temperature over time with x=[1,2,3,4,5,6] and y=[2,4,3,5,6,7]" | 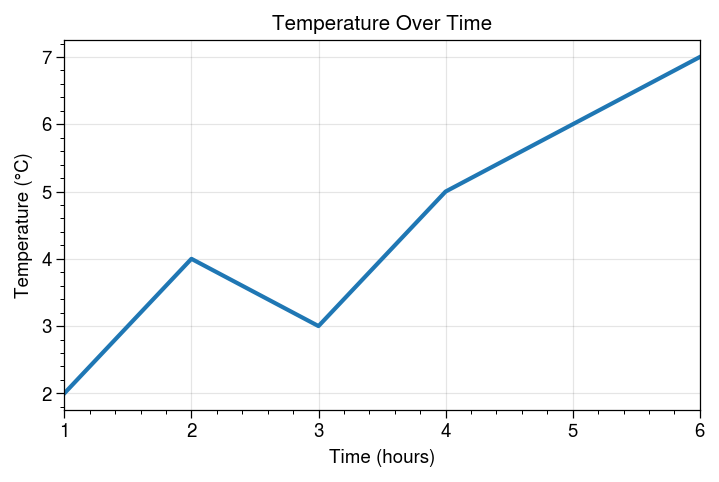 |
| Scatter Plot "Make a scatter plot with color and size mapping using plasma colormap" | 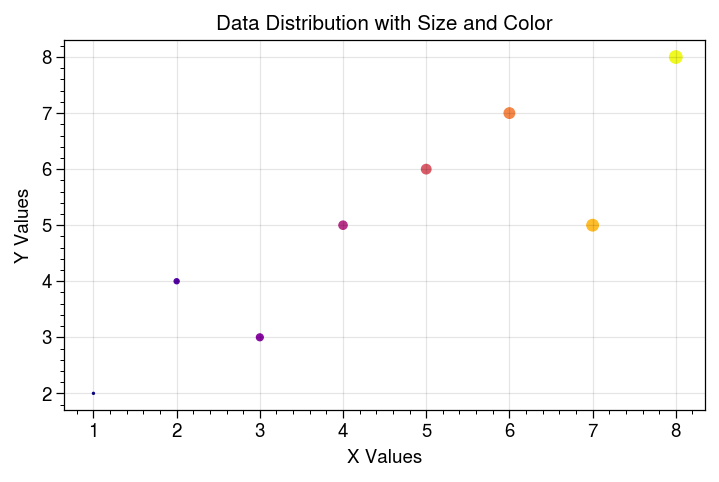 |
| Bar Chart "Generate a bar chart comparing performance across categories A through E" | 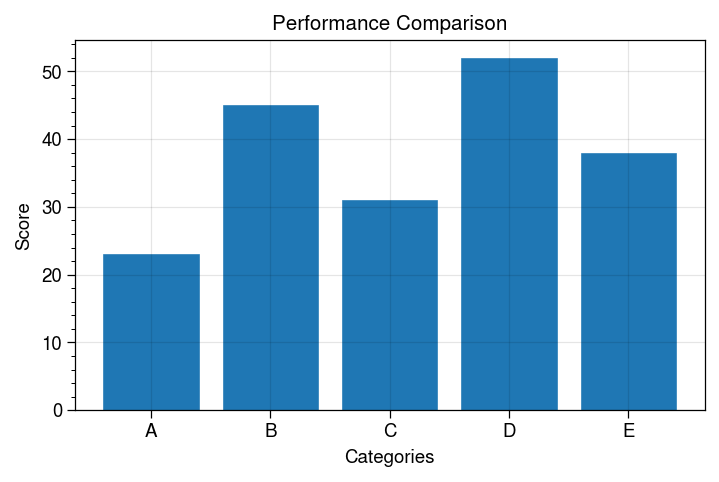 |
| Histogram "Create a histogram with density normalization for distribution analysis" | 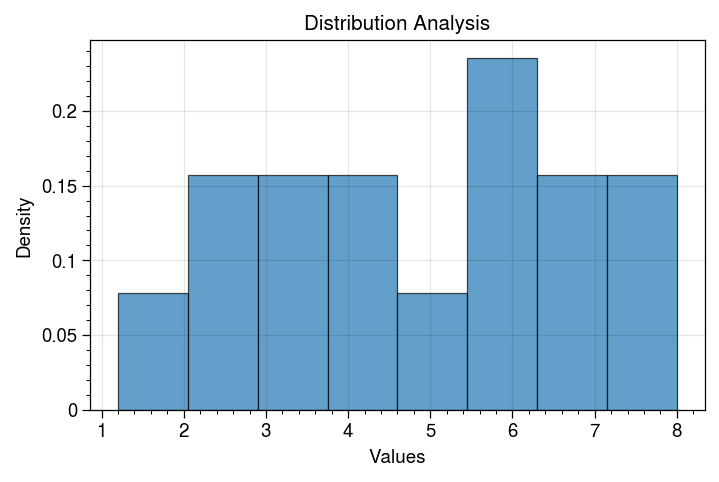 |
| Violin Plot "Make a violin plot comparing Control vs Treatment groups" | 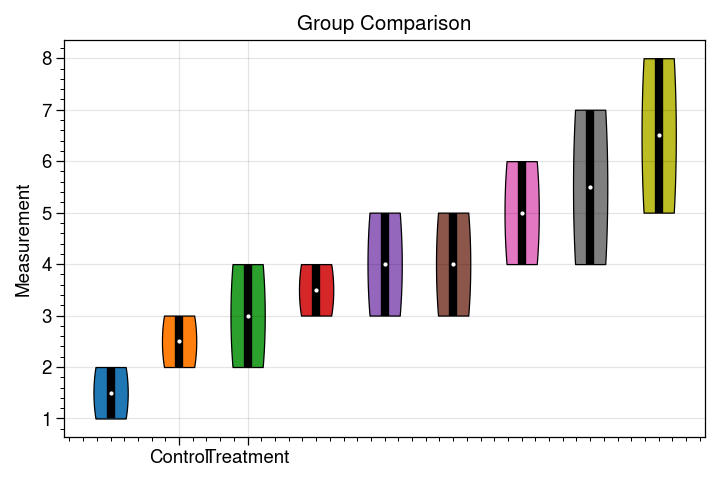 |
| Heatmap "Generate an annotated correlation matrix heatmap using RdBu colormap" | 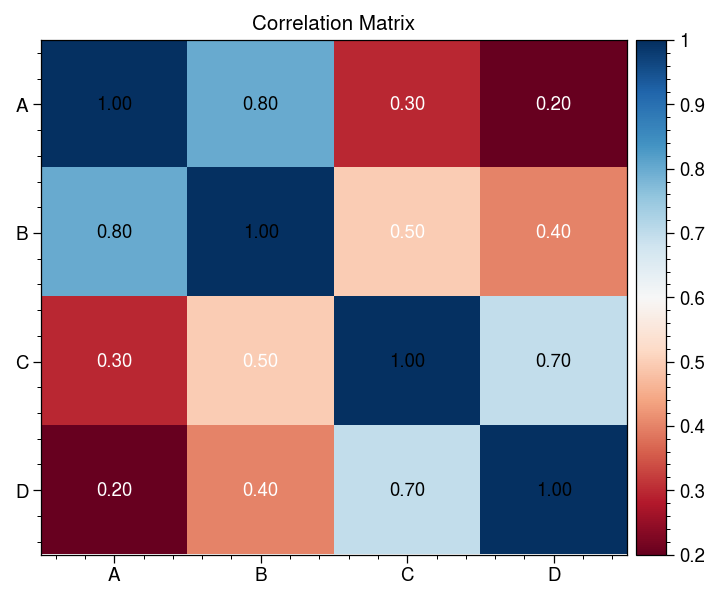 |
All plots generated with publication-quality settings (150 DPI, customizable dimensions).
Documentation
Visualization Tools (Phase 1)
Basic Plotting Tools
plot_line
plot_line(
    x: str | list[float],
    y: str | list[float],
    data_input: dict | None = None,
    style: dict | None = None,
    output: dict | None = None
) -> Image | bytes
Parameters:
x,y: Column names (if using file) or data arraysdata_input:{"file_path": "data.csv"}or{"data": {...}}style:{"title": "...", "xlabel": "...", "ylabel": "...", "grid": true}output:{"format": "png/pdf/svg", "width": 15, "height": 10, "dpi": 300}
plot_scatter
Additional parameters:
size: Point sizes (column name, array, or constant)color: Point colors (column name or array)
plot_bar
Additional parameters:
orientation:"vertical"or"horizontal"
Statistical Tools
plot_histogram
plot_histogram(
    data: str | list[float],
    bins: int = 30,
    density: bool = False,
    ...
)
plot_box
plot_box(
    data: str | list[list[float]],
    labels: list[str] | None = None,
    ...
)
plot_violin
Similar to plot_box with kernel density estimation.
2D Visualization Tools
plot_heatmap
plot_heatmap(
    data: str | list[list[float]],
    x_labels: list[str] | None = None,
    y_labels: list[str] | None = None,
    annotate: bool = False,
    ...
)
plot_contour
plot_contour(
    x: str | list[float],
    y: str | list[float],
    z: str | list[list[float]],
    levels: int = 10,
    filled: bool = True,
    ...
)
plot_pcolormesh
Fast alternative to contour plots with shading options.
Future Tools (Planned)
Documentation will be added as features are implemented.
Development
Project Structure
ml-research-mcp/
├── src/ml_research_mcp/
│   ├── server.py              # MCP server entry point
│   ├── data/                  # Data I/O modules
│   ├── plotting/              # Phase 1: Visualization
│   ├── tools/                 # MCP tool definitions
│   │   ├── plot_basic.py
│   │   ├── plot_statistical.py
│   │   └── plot_2d.py
│   ├── generation/            # Phase 2: Image generation (planned)
│   ├── presentation/          # Phase 3: Slides/posters (planned)
│   └── research/              # Phase 4: Research tools (planned)
├── tests/                     # Comprehensive test suite
└── docs/                      # Extended documentation (planned)
Running the Server
# Development mode
uv run ml-research-mcp

# Or as module
uv run python -m ml_research_mcp.server
Testing
# All tests (48 tests, 100% pass rate)
uv run pytest

# With coverage report
uv run pytest --cov=src --cov-report=html

# Specific test suite
uv run pytest tests/test_plot_basic.py -v
Code Quality
# Format code
uv run ruff format .

# Lint and type check
uv run ruff check .
uv run ty check
Adding Dependencies
uv add <package>           # Runtime dependency
uv add --dev <package>     # Development dependency
uv lock --upgrade          # Update lockfile
Architecture
Current Design (Phase 1)
Input Data (CSV/JSON/Array)
    ↓
Polars DataFrame Processing
    ↓
UltraPlot Rendering
    ↓
Output (PIL Image / bytes)
Future Architecture
The platform is designed to be modular, with each research tool category as a separate module:
- Data Module: Unified data loading (Polars-based)
- Visualization Module: Current plotting tools
- Generation Module: AI-powered content creation
- Presentation Module: Slide and poster generation
- Research Module: Literature and experiment management
Each module exposes MCP tools that can be independently used or composed together.
Technology Stack
Current (Phase 1)
- FastMCP - MCP server framework
- UltraPlot - Publication-quality plotting
- Polars - High-performance dataframes
- Pillow - Image processing
- Pydantic - Data validation
Planned
- Diffusion models (Stable Diffusion, DALL-E) for image generation
- LaTeX/Typst for presentation rendering
- Vector database for literature search
- More to be determined based on research needs
Contributing
We welcome contributions across all phases of the project!
Current Priorities
- ✅ Phase 1 visualization tools (complete)
- 🔨 Additional plot types (3D, network graphs, etc.)
- 🚧 Phase 2 planning and design
How to Contribute
- Fork the repository
- Create a feature branch
- Implement with tests (maintain 100% pass rate)
- Ensure quality checks pass:
uv run ruff format . uv run ruff check . uv run ty check uv run pytest - Submit a pull request
See CONTRIBUTING.md (coming soon) for detailed guidelines.
Project Goals
- Comprehensive: Cover the full research lifecycle from data analysis to publication
- High-quality: Publication-ready outputs with professional standards
- Efficient: Fast execution leveraging modern Python tools
- Extensible: Easy to add new tools and integrations
- AI-friendly: Designed for seamless AI assistant integration via MCP
Testing & Quality
- 48 tests covering all Phase 1 functionality
- 100% pass rate with comprehensive coverage
- Type-safe with full type annotations
- Linted with Ruff (zero errors)
- Documented with detailed docstrings
License
MIT License - see LICENSE file for details.
Acknowledgments
Current Phase
- FastMCP by Jeff Lowin
- UltraPlot - ProPlot successor
- Polars - Rust-powered dataframes
- uv - Fast Python packaging
Inspiration
- Model Context Protocol by Anthropic
- Modern scientific Python ecosystem
Resources
- Model Context Protocol Documentation
- FastMCP Documentation
- UltraPlot Documentation
- Project Issues & Discussions
Status: Phase 1 (Visualization) complete ✅ | Phase 2 (Image Generation) in planning 🚧
For feature requests or questions, please open an issue on GitHub.