
NVEIL Toolkit
Describe your data. Get production charts. Your data stays local.




Quickstart • API Reference • Examples • Changelog
NVEIL is an AI-powered data visualization toolkit. Write one line of natural language, and NVEIL processes your data and generates publication-ready visualizations — no chart code, no hallucinations, no data leaving your machine.
import nveil

nveil.configure(api_key="nveil_...")

# Pass a file path directly — no DataFrame loading required.
spec = nveil.generate_spec("Revenue by region, colored by quarter", "sales.csv")

fig = spec.render("sales.csv")   # 100% local — no API call
nveil.show(fig)                   # opens in browser
From your shell
After pip install nveil the nveil command is on your $PATH:
export NVEIL_API_KEY=nveil_...

# Ground yourself on the dataset (shape / dtypes / head preview)
nveil describe sales.csv

# Generate HTML + PNG + a reusable .nveil spec, print the explanation
nveil generate "Revenue by region, colored by quarter" \
  --data sales.csv --format all --explain

# Re-render an existing spec on fresh data — no API call
nveil render chart.nveil --data new_sales.csv
For AI agents (Claude Code / Claude Desktop / Cursor / Codex / …)
NVEIL ships first-class integrations:
# Claude Code / Claude Desktop — install the bundled skill
nveil install-skill

# Claude Desktop, Cursor, any MCP client — add an MCP server:
# {"mcpServers": {"nveil": {"command": "nveil", "args": ["mcp"]}}}
nveil mcp                    # stdio server; launched by the MCP client
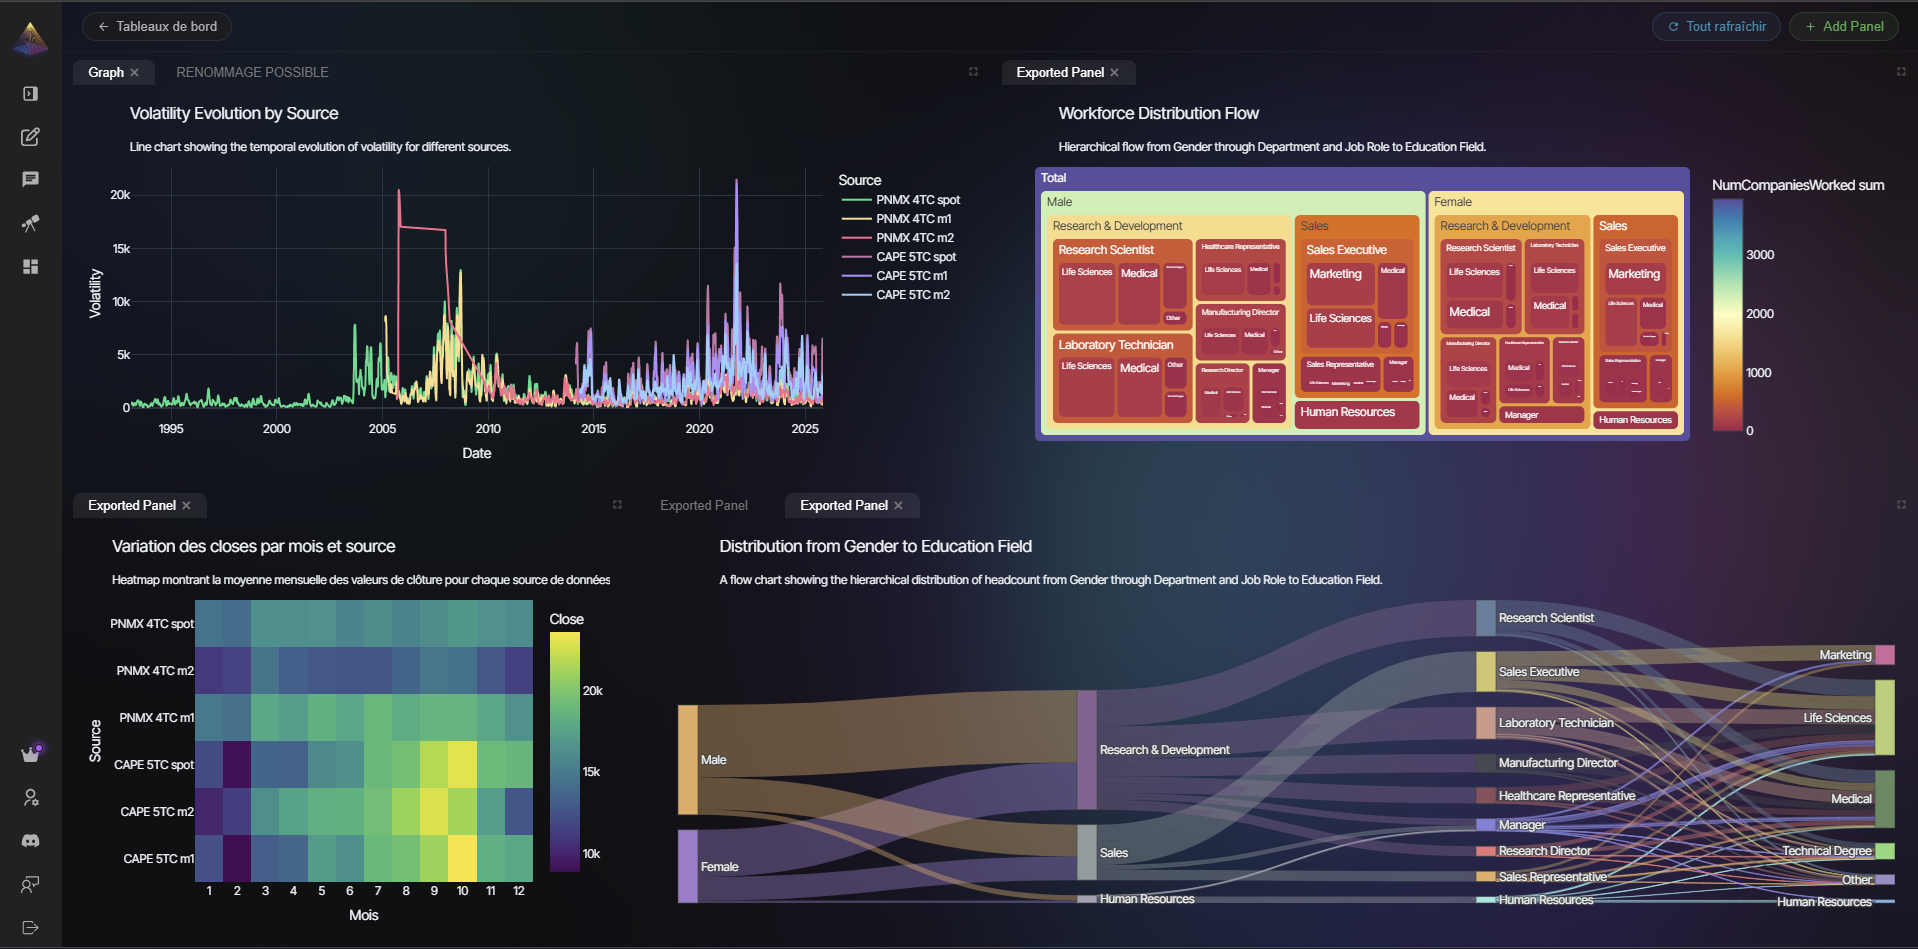
Why NVEIL?
| Capability | NVEIL | Chatbot data analysis¹ | LLM-to-viz libraries² | Traditional plotting³ |
|---|---|---|---|---|
| Natural-language input | ✓ | ✓ | ✓ | ✗ |
| Raw data stays on your machine | ✓ | ✗ | ✗ | ✓ |
| Only schema + stats sent to server | ✓ | ✗ | ✗ | N/A |
| Deterministic, reproducible output | ✓ | ✗ | ✗ | ✓ |
| Offline re-rendering, zero API calls | ✓ | ✗ | ✗ | ✓ |
Portable saved specs (.nveil files) | ✓ | ✗ | ✗ | ✗ |
| 2D + 3D + geospatial + scientific | ✓ | 2D | 2D | varies |
| Multi-backend (Plotly, VTK, DeckGL) | ✓ | ✗ | ✗ | ✗ |
| Data processing engine | ✓ | ✓ | partial | ✗ |
¹ ChatGPT Advanced Data Analysis, Claude Analysis tool, Gemini Data Agent · ² PandasAI, LIDA, Julius, Vanna · ³ Plotly, Matplotlib, Seaborn
How It Works
Your Data ──> Toolkit ──metadata only──> NVEIL AI ──> Processing Plan ──> Local Execution ──> Result
               ^                                                           ^
          raw data stays here                                     raw data stays here
- You describe what you want in plain language
- NVEIL AI plans the data processing and visualization (only metadata is sent — column names, types, statistics)
- The Toolkit executes locally — joins, aggregations, pivots, rendering — all on your machine
- You get a figure — Plotly, VTK, or DeckGL, auto-selected for your data
Key Features
🧠 Two Engines in OneData processing (joins, pivots, aggregations, geocoding, time series) AND visualization generation from a single prompt. 🔒 Data Privacy by DesignRaw data never leaves your machine. Only column names, types, and aggregate statistics are sent. 📈 Multi-Backend RenderingAuto-detects the best engine: Plotly (2D charts), VTK (3D/medical), DeckGL (geospatial). |
🧪 Auditable ResultsPowered by constraint solving, not random generation. Same input = same output, every time. ⚡ Offline Rendering
💾 Reusable SpecsSave to |
Beyond Simple Charts
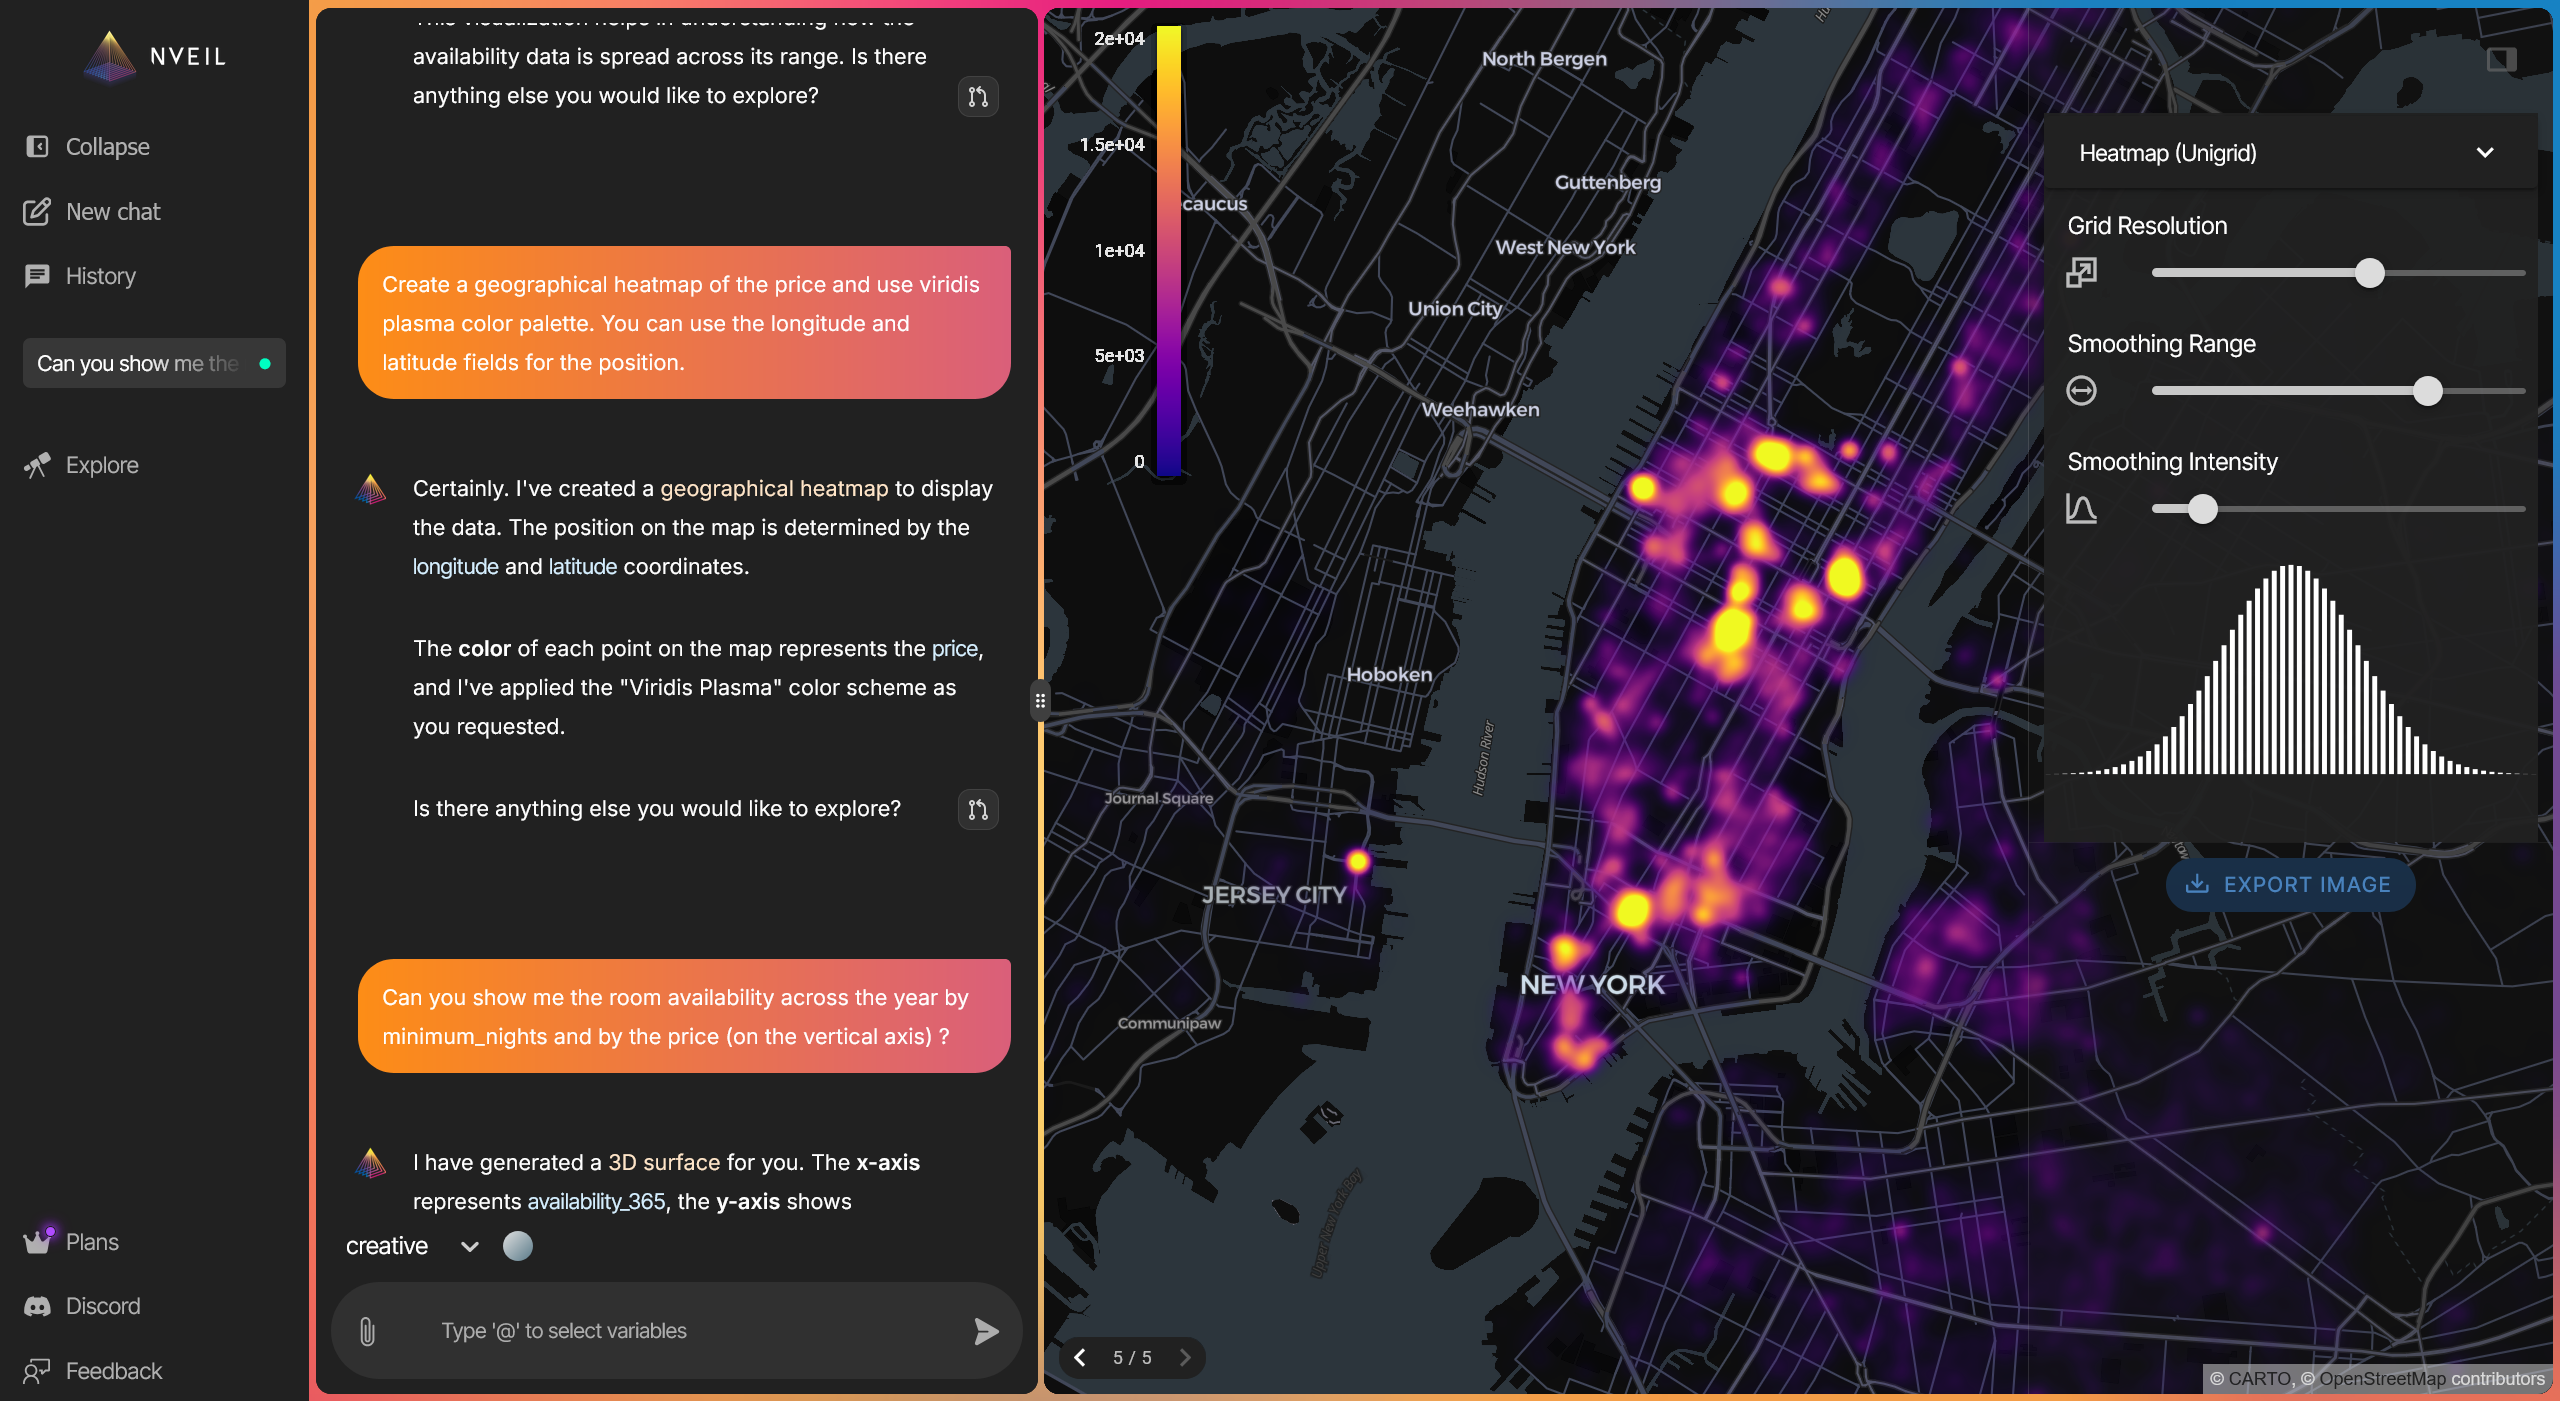
NVEIL handles geospatial heatmaps, 3D volumes, scientific visualizations, medical imaging (DICOM), network graphs, and 50+ other visualization types — all from natural language.
Save Once, Render Forever
# Generate once (API call)
spec = nveil.generate_spec("Monthly trend by category", df)
spec.save("trend.nveil")

# Reload anywhere — no API call, no server, no cost
spec = nveil.load_spec("trend.nveil")
fig = spec.render(fresh_data)
nveil.save_image(fig, "report.png")
Installation
pip install nveil
Requirements: Python 3.10+
Getting Started
- Create an account at app.nveil.com
- Generate an API key in Settings
- Start visualizing
import os
import nveil

nveil.configure(api_key=os.environ["NVEIL_API_KEY"])

spec = nveil.generate_spec("scatter plot of price vs area", df)
fig = spec.render(df)
nveil.show(fig)
See the examples/ directory for more usage patterns.
Documentation
Full documentation is available at docs.nveil.com:
- Quickstart Guide
- Core Concepts — sessions, specs, and the two-stage flow
- API Reference — full reference for all public functions
- Privacy Model — what data is sent, what stays local
- Examples — bar charts, multi-dataset, offline rendering
Contributing
NVEIL is proprietary software. Bug reports and feature requests are welcome via GitHub Issues.
License
Proprietary. See LICENSE for details.