Give your AI assistant eyes into production
Self-hosted observability server with 75+ MCP tools.
Ingest logs, connect Postgres, monitor servers — then debug it all from Claude, Cursor, or any MCP client.


Quick Start · MCP Tools · Features · Deploy · Docs
Why OpenTrace?
Your AI coding assistant can read your code — but it's blind to what's happening in production. OpenTrace fixes that.
- No more copy-pasting stack traces, log snippets, or query plans into chat
- No cloud vendor required — single binary, SQLite storage, runs anywhere
- MCP-native — not an afterthought API wrapper; every feature is designed as an MCP tool with guided workflows
- Your data stays yours — fully self-hosted, no telemetry, no external calls
Quick Start
Docker (fastest):
docker run -d --name opentrace -p 8080:8080 -v opentrace-data:/data ghcr.io/adham90/opentrace:latest
From source:
git clone https://github.com/adham90/opentrace.git && cd opentrace
cp .env.example .env
go build -o opentrace ./cmd/opentrace && ./opentrace
Open localhost:8080 — first visit triggers admin setup.
Then connect it to your AI assistant:
// .mcp.json (Claude Code) or claude_desktop_config.json (Claude Desktop)
{
  "mcpServers": {
    "opentrace": {
      "type": "stdio",
      "command": "/path/to/opentrace",
      "args": ["mcp"]
    }
  }
}
Now ask your assistant: "What errors are happening in production?"
MCP Tools
OpenTrace exposes 75+ tools over MCP (stdio + SSE). The server sends guided instructions at handshake time and returns suggested_tools with pre-filled arguments, so your AI assistant knows what to call next.
Overview & Triage
| Tool | What it does |
|---|---|
diagnose | One-call health check: errors, logs, performance, watches, and health checks |
system_overview | High-level system health dashboard |
triage_alerts | Prioritized inbox of items needing attention |
runbook | Composite playbooks for slow_database, error_spike, disk_pressure, etc. |
Log Intelligence
| Tool | What it does |
|---|---|
log_search | Full-text search with filters: service, level, env, trace ID, exception class, metadata |
log_context | Surrounding log entries around a specific log |
log_summary | Error rates, active deploys, top errors with file:line, slowest endpoints |
trace_lookup | Assemble a distributed trace from log entries |
request_performance | N+1 query detection, slowest endpoints, SQL-heavy requests |
compare_periods | Period-over-period comparison of error rates and log volume |
Database Introspection (Postgres)
| Tool | What it does |
|---|---|
db_query_stats | Top queries from pg_stat_statements by time/calls/rows |
db_table_stats | Row counts, dead tuples, cache hit ratios, vacuum status |
db_activity | Active connections, long-running queries, idle-in-transaction |
db_locks | Lock contention chains and blocking queries |
db_index_analysis | Unused, missing, duplicate, bloated indexes with CREATE/DROP suggestions |
explain_query | EXPLAIN ANALYZE with optimization tips |
bloat_estimate | Table and index bloat with reclaimable space |
replication_status | Replica lag, slot status, WAL archival |
Errors (Sentry-like)
| Tool | What it does |
|---|---|
error_groups | Errors grouped by fingerprint with occurrence counts |
investigate_error | Deep dive: backtrace, cause chain, request params, SQL queries, surrounding logs |
error_impact | How many users hit each error, affected user lists, impact scores |
Analytics & Journeys
| Tool | What it does |
|---|---|
trends | Time-series for error rate, p95 response, request volume with deploy markers |
user_journey | Reconstruct a user's request sequence in a session |
funnel_analysis | Define and measure conversion funnels |
incident_timeline | Chronological merge of errors, alerts, health check changes |
See all 75+ tools
Uptime: list_healthchecks, uptime_status, create_healthcheck, delete_healthcheck
Watches: watch_status, watch (create threshold alerts), investigate, dismiss_watch
Server Metrics: list_servers, query_metrics, server_health
Connectors: list_connectors, get_connector, create_connector, test_connector, update_connector, delete_connector
More Database: schema_overview, vacuum_report, disk_usage, pg_config_check, checkpoint_stats, sequence_health, long_transactions, connection_pool_stats, kill_query, db_search (per-connector)
More Analytics: top_movers, web_analytics, top_endpoints, traffic_heatmap, path_analysis, request_timeline, session_waterfall
More Logs: log_stats, list_log_attributes, log_context
Agent Memory: get_notes, add_note, delete_note — persistent notes across sessions
Settings: get_settings, update_retention, list_users, get_audit_log
Guided Workflows
Tools return suggested_tools with pre-filled arguments, chaining naturally:
diagnose → error_detail → log_search (with exception_class pre-filled)
                        → trace_lookup (with trace_id pre-filled)

db_query_stats → explain_query (with slowest query pre-filled)

triage_alerts → investigate → log_search (with service + error level)
Your AI assistant follows these suggestions automatically — no prompt engineering needed.
See the full MCP integration guide for setup instructions and complete tool reference.
Features
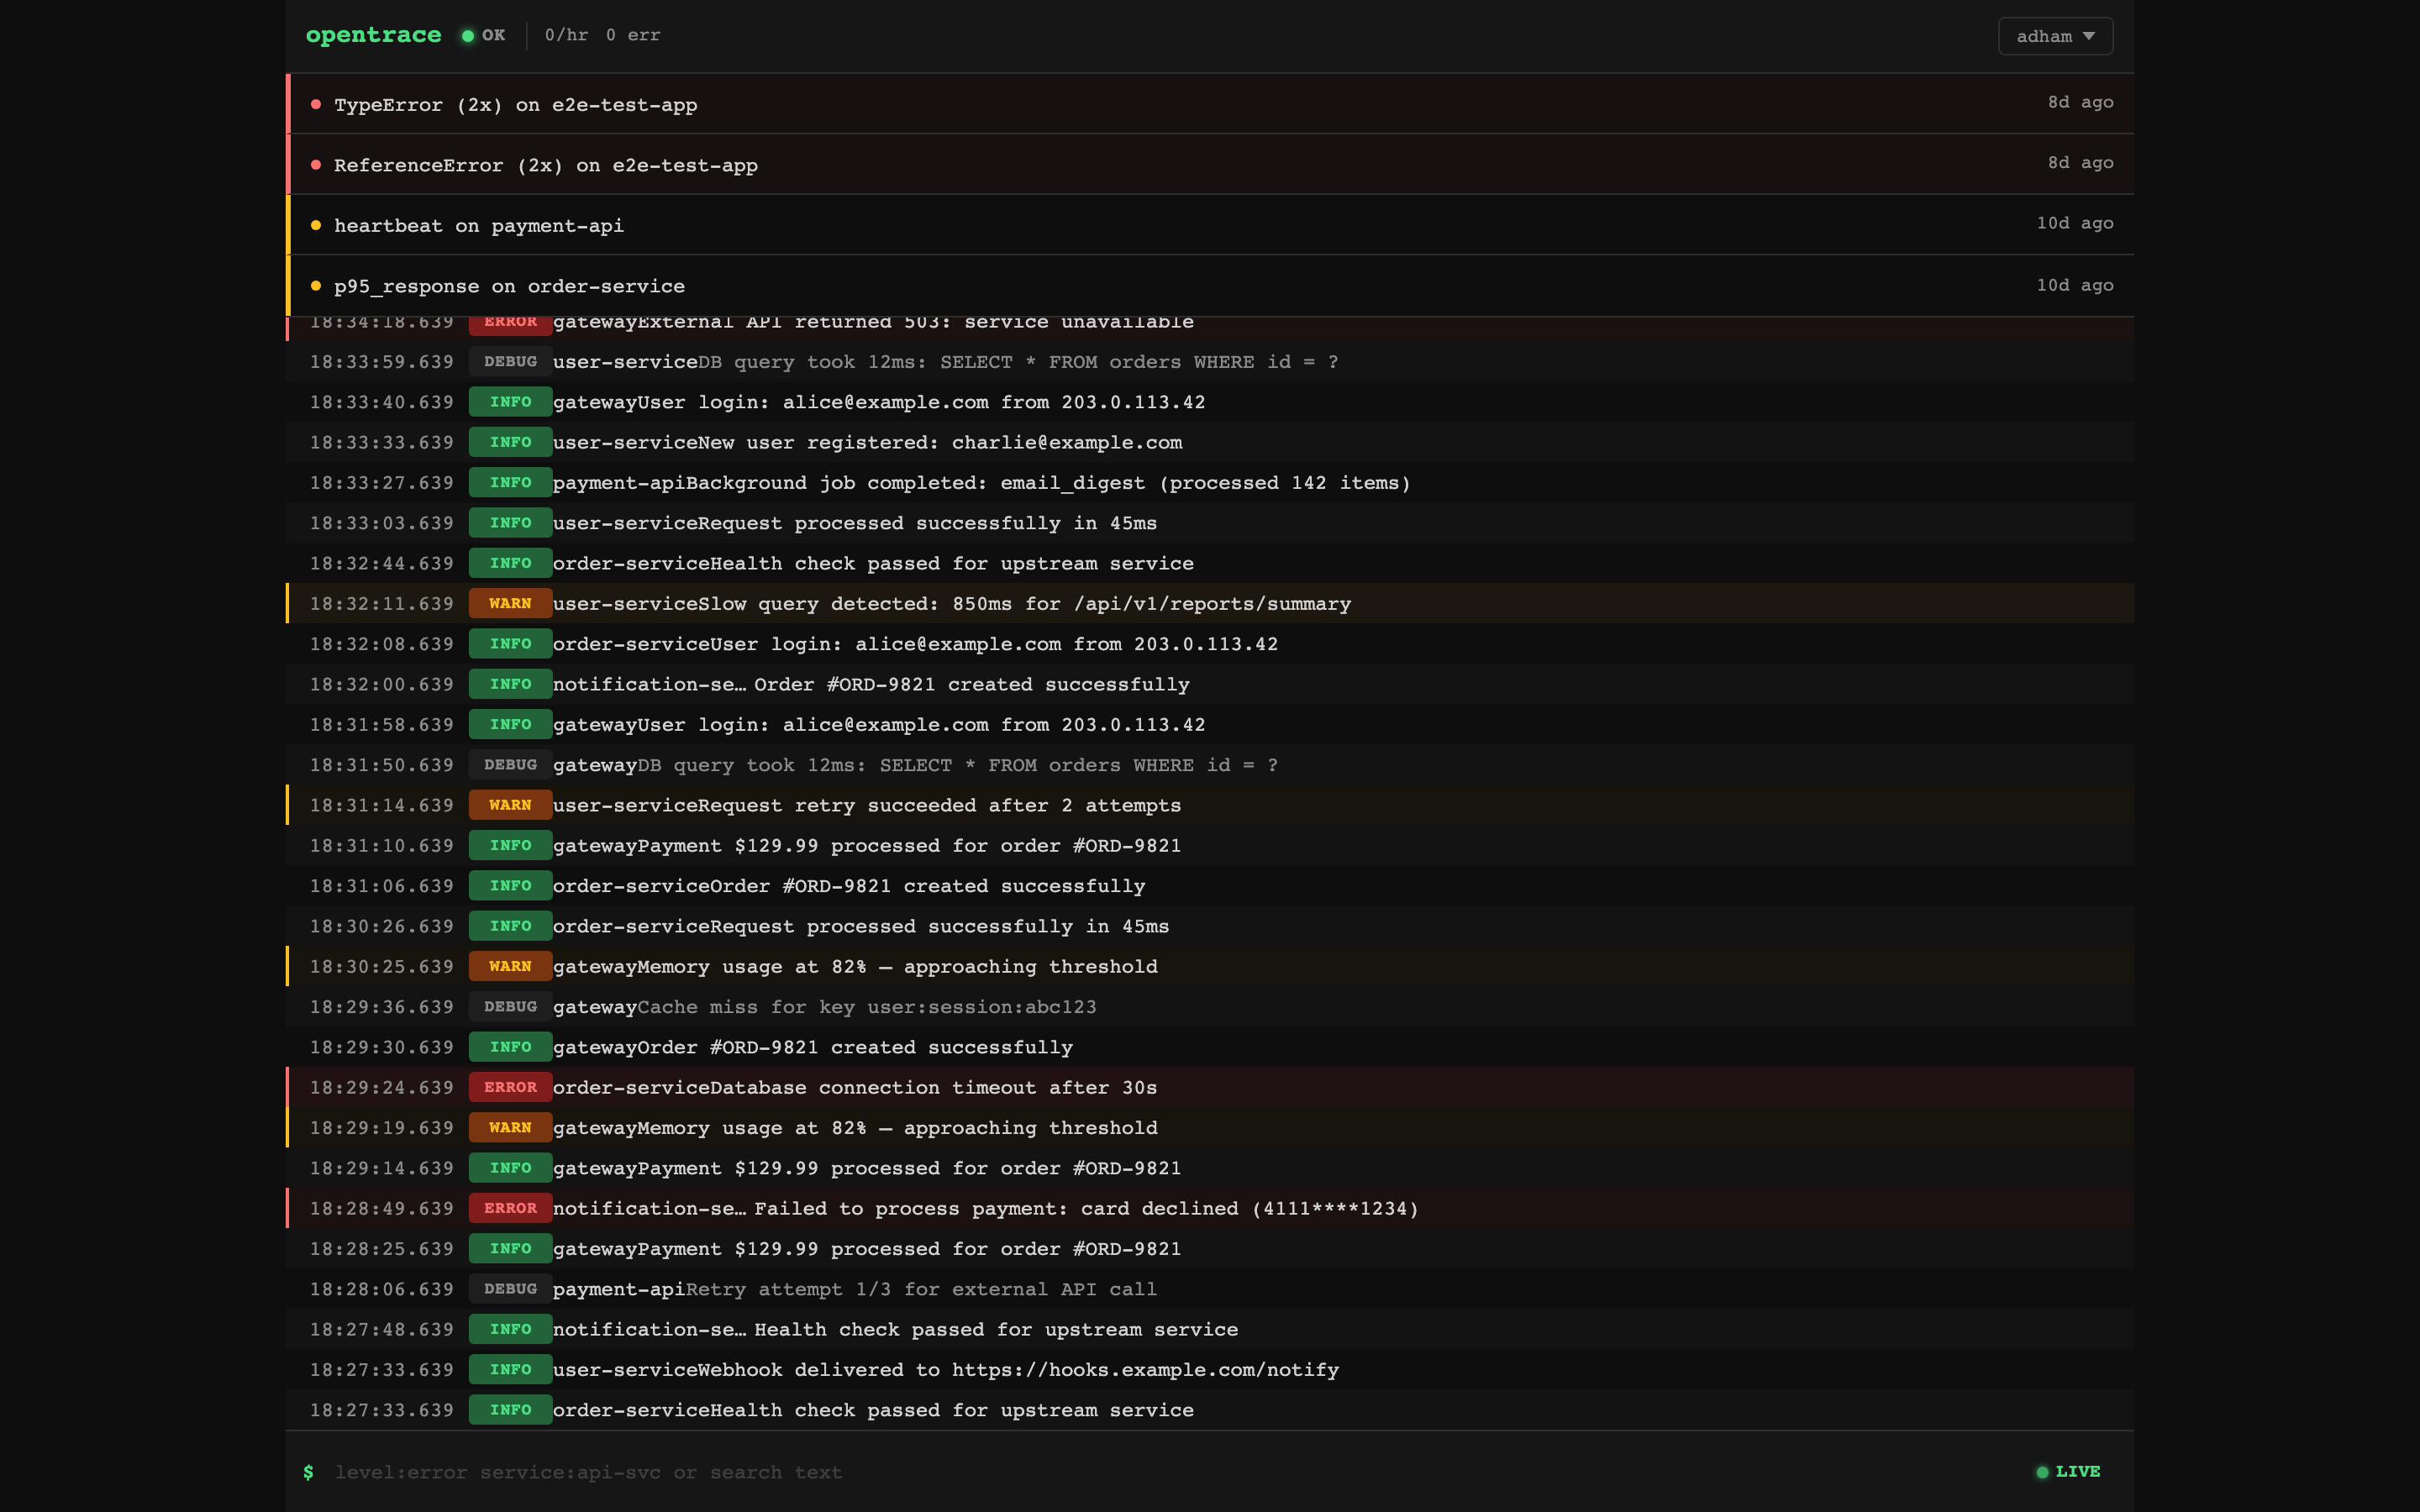
Dashboard — Live Logs & Alerts
Real-time log stream with attention zone showing active alerts. Click any log entry to expand details. Filter by level, service, or free-text search.
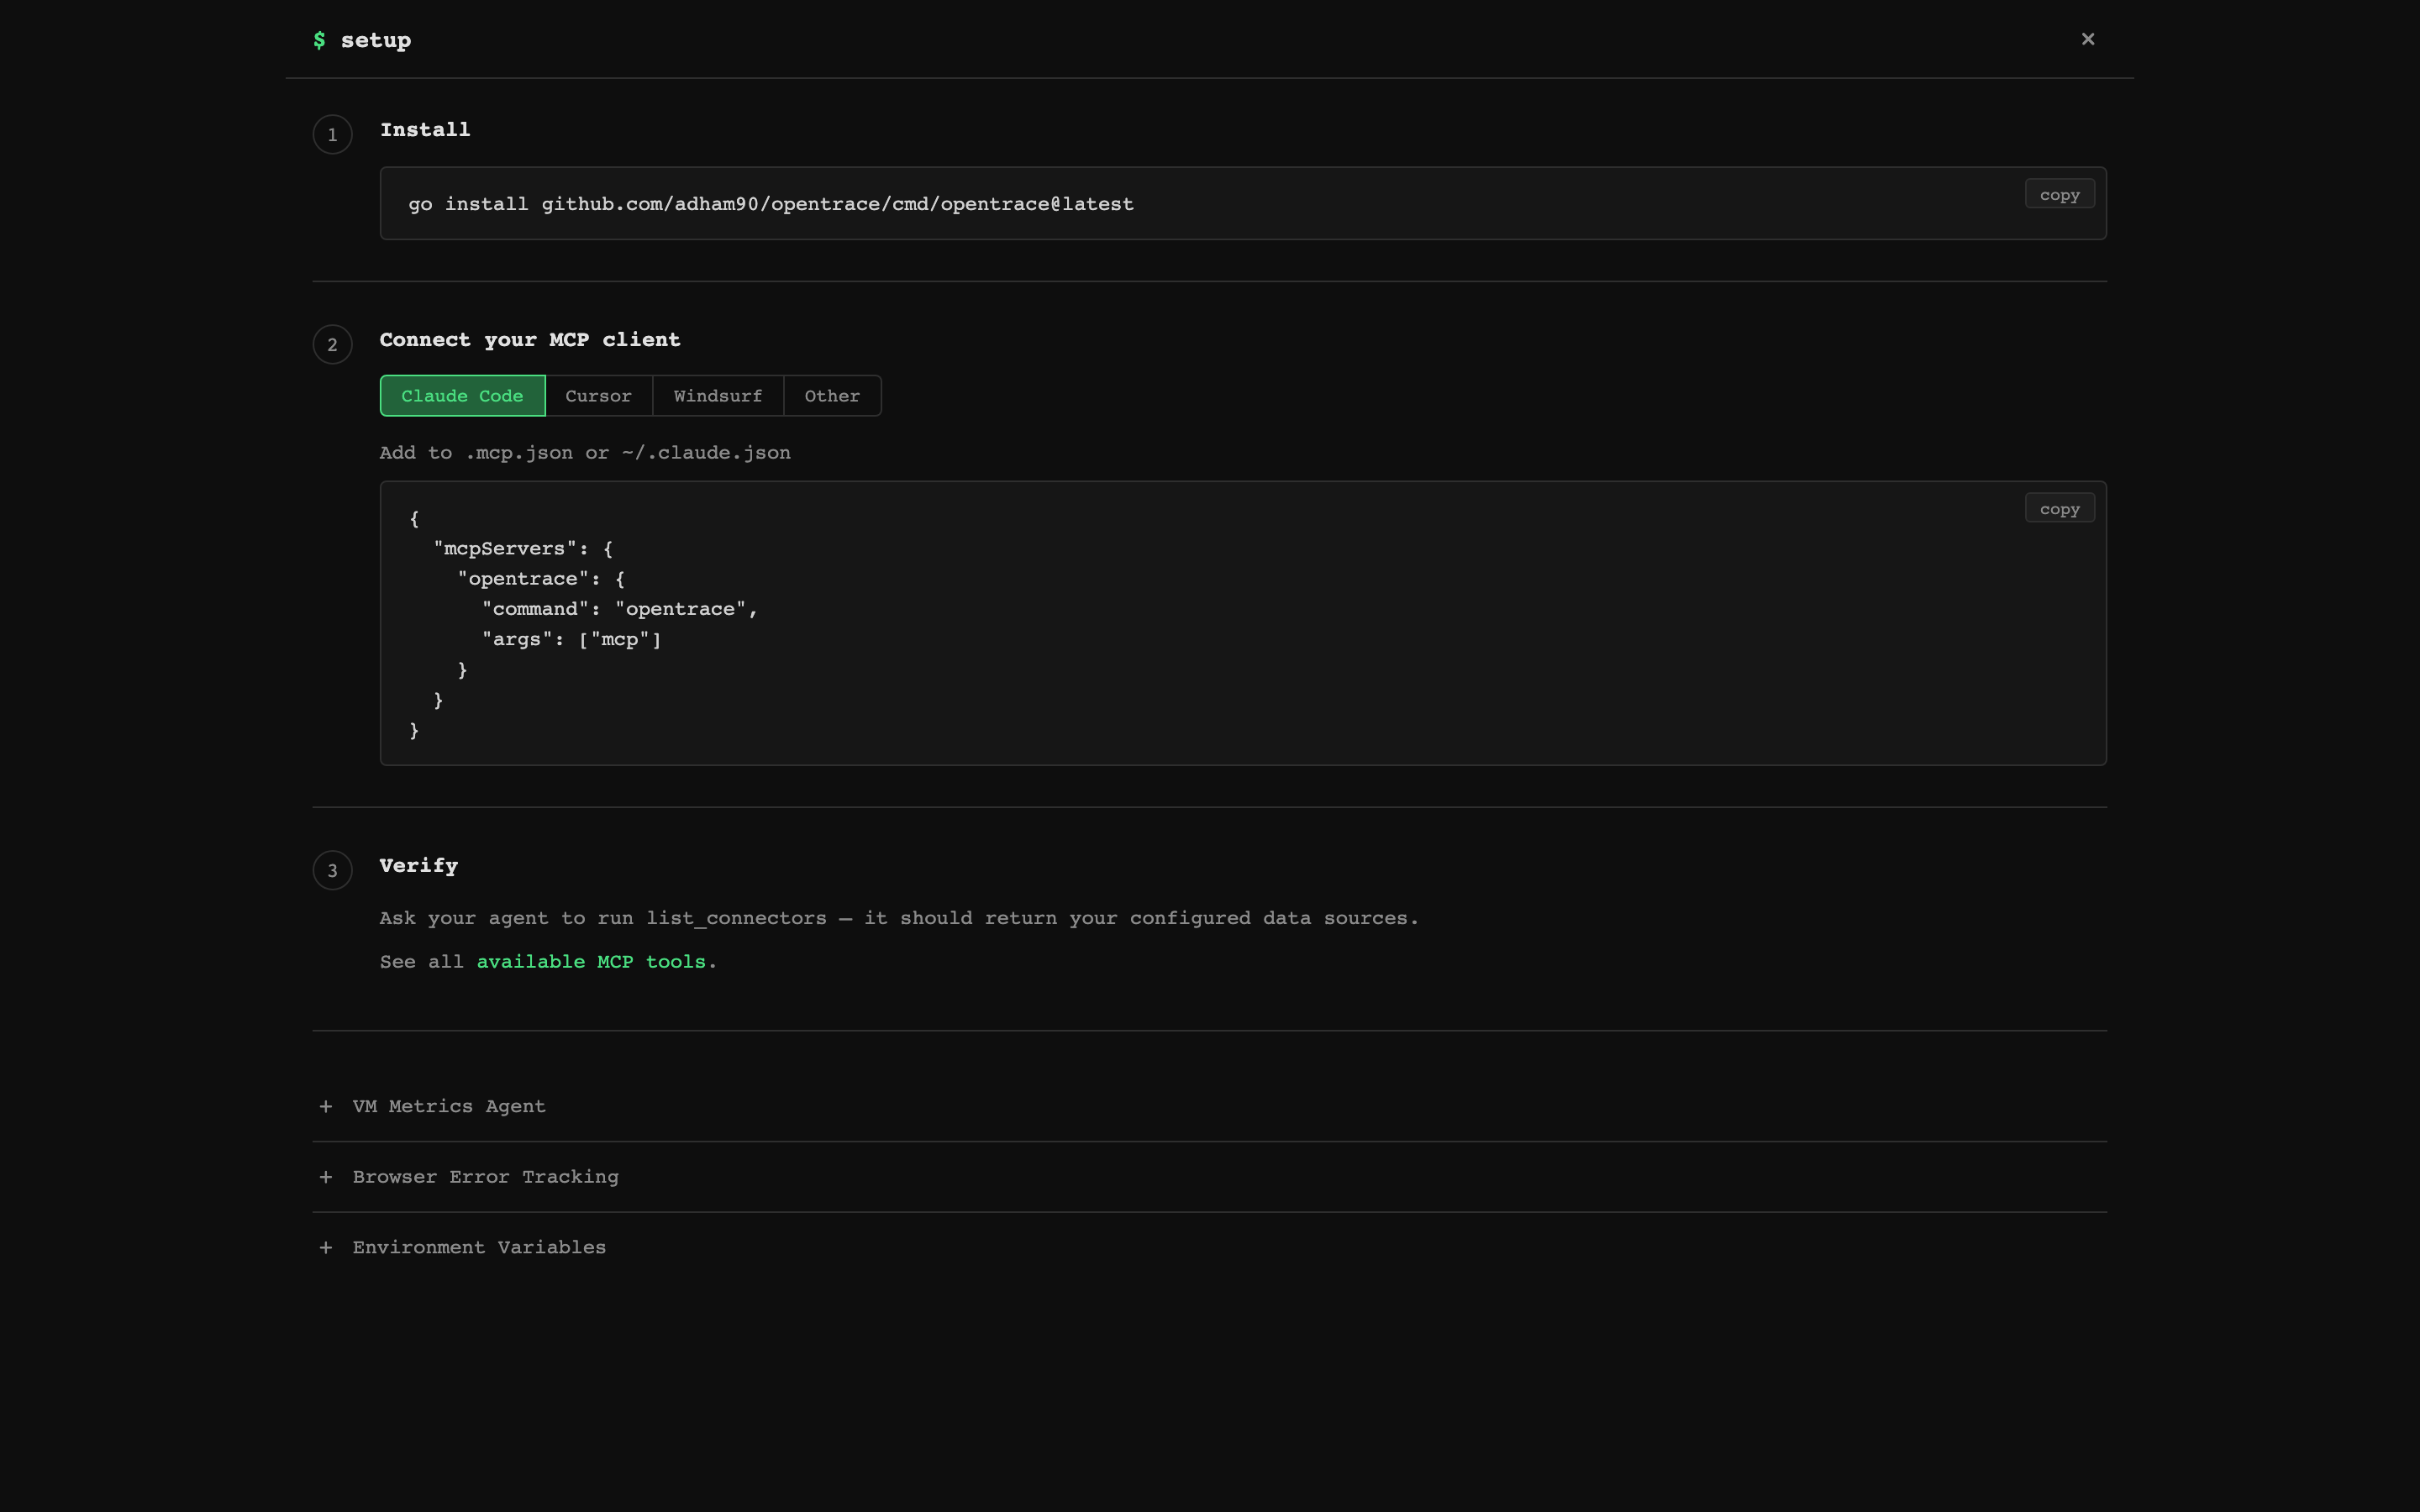
MCP Setup — Connect in 3 Steps
Built-in setup page with copy-paste configs for Claude Code, Cursor, Windsurf, and any MCP client. Includes a one-line install command.
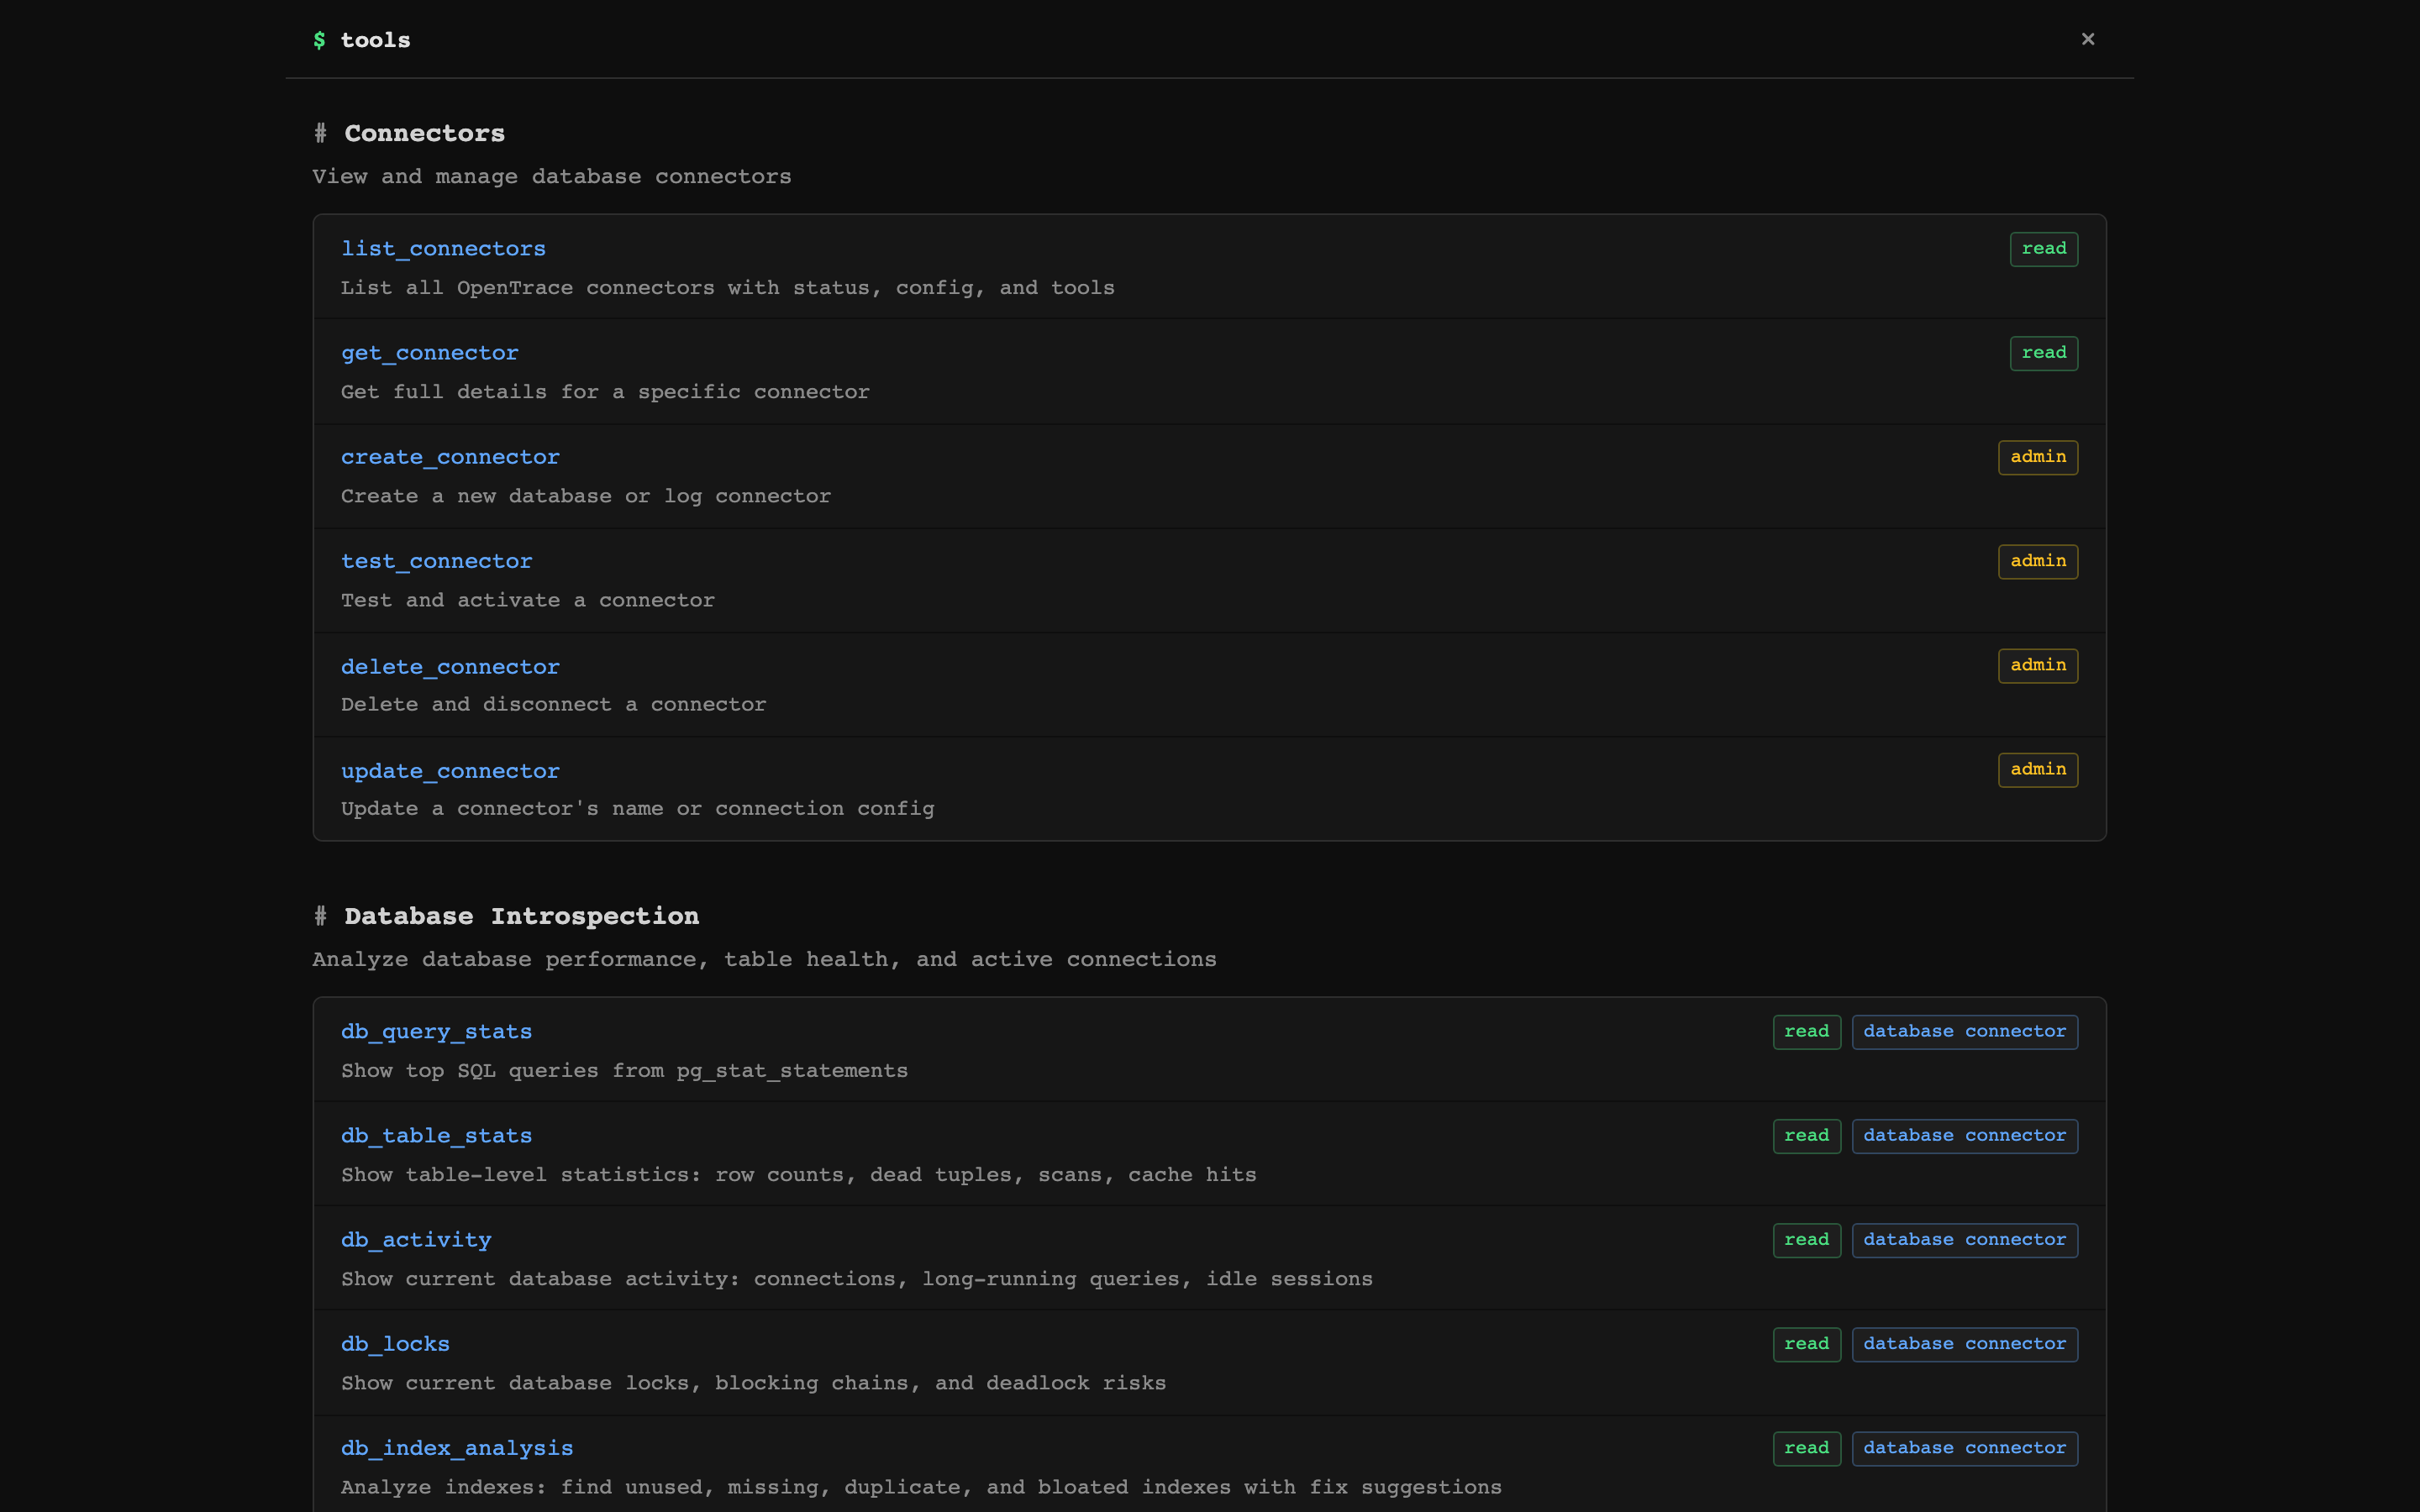
75+ MCP Tools — Organized by Category
Every tool is browsable in the web UI with descriptions, access levels, and connector requirements.
Log Ingestion
Ingest structured logs via HTTP, search with SQLite FTS5. Filter by service, level, environment, trace ID, commit hash, exception class, or any metadata field.
curl -X POST http://localhost:8080/api/logs \
  -H "Content-Type: application/json" \
  -H "Authorization: Bearer YOUR_API_KEY" \
  -d '{
    "service": "payment-api",
    "level": "error",
    "message": "Payment gateway timeout after 30s",
    "environment": "production",
    "event_type": "payment.failed",
    "metadata": {"transaction_id": "tx_abc123"}
  }'
Official client libraries handle async dispatch, batching, PII scrubbing, and graceful shutdown — your app never blocks or crashes due to OpenTrace:
| Client | Platform | Install |
|---|---|---|
| @opentrace-sdk/node | Node.js (Express, Fastify, Hono) | npm install @opentrace-sdk/node |
| opentrace | Ruby / Rails | gem 'opentrace' |
| opentrace.js | Browser | <script src="opentrace.min.js"> |
All three clients share the same safety-first design: never raise/throw to the host app, bounded queues, smart truncation, and W3C trace context propagation.
Postgres Connector
Connect read-only to your production Postgres databases. All queries are validated SELECT-only via SQL AST parsing, with configurable timeouts and row limits. Introspection tools read from pg_stat_* views — no application changes needed.
Rule-Based Watches
Threshold monitors on log-derived metrics: error_rate, error_count, response_time, p95_response, sql_count, cache_hit_rate, heartbeat, log_count. Supports cron schedules, consecutive-breach requirements, and auto-resolve when metrics return to baseline.
Server Monitoring
Lightweight agent (opentrace agent) collects CPU, memory, disk, network, and load metrics via gopsutil and pushes to the dashboard. Agent docs.
Deploy
One-Click
| Platform | Notes | |
|---|---|---|
| DigitalOcean |  | ~$5/mo |
| Railway |  | Free tier |
| Render |  | Free tier |
Docker Compose
# Development
docker compose up -d

# Production (with auto-updates via Watchtower)
docker compose -f docker-compose.prod.yml up -d
Binary
Download from GitHub Releases:
curl -L https://github.com/adham90/opentrace/releases/latest/download/opentrace_linux_amd64.tar.gz | tar xz
./opentrace
Fly.io
fly launch --copy-config --no-deploy
fly deploy
More deployment options
Hetzner: ./deploy/deploy.sh — full VPS with Caddy + automated backups (~$4/mo)
Systemd:
[Unit]
Description=OpenTrace
After=network.target

[Service]
Type=simple
ExecStart=/opt/opentrace/opentrace
EnvironmentFile=/opt/opentrace/.env
Restart=always

[Install]
WantedBy=multi-user.target
Data storage: Everything lives in a single SQLite file at ~/.opentrace/opentrace.db (override with OPENTRACE_DATA_DIR). WAL mode for concurrent reads. Back up this one file.
Auto-updates: The production Docker Compose includes Watchtower. For binary installs, the dashboard shows a banner when a new version is available.
See the full deployment guide for all options including Hetzner, systemd, TLS, and configuration reference.
Configuration
All configuration via environment variables (.env file):
| Variable | Default | Description |
|---|---|---|
OPENTRACE_LISTEN_ADDR | :8080 | HTTP listen address |
OPENTRACE_DATA_DIR | ~/.opentrace | SQLite database directory |
OPENTRACE_API_KEY | (empty) | Bearer token for log ingestion |
OPENTRACE_MAX_QUERY_ROWS | 500 | Max rows from SQL queries |
OPENTRACE_STATEMENT_TIMEOUT_MS | 5000 | SQL query timeout (ms) |
OPENTRACE_MCP_TOKEN | (empty) | Token for MCP SSE transport |
See .env.example for the full list including TLS, CORS, retention, and proxy settings.
Architecture
                         ┌────────────────────────────┐
  ┌──────────┐           │       Web UI (HTMX)        │         ┌────────────┐
  │ VM Agent │──metrics─▶│  Alerts │ Logs │ Watches    │◀─browse─│  You / CI  │
  └──────────┘           └────────────┬───────────────┘         └────────────┘
                                      │
  ┌──────────┐           ┌────────────▼───────────────┐         ┌────────────┐
  │ Your App │──logs────▶│     HTTP Server (Chi)       │◀─stdio─│Claude/MCP  │
  └──────────┘           │    REST API + MCP Server    │        │  Client    │
                         └────────────┬───────────────┘         └────────────┘
                                      │
             ┌────────────────────────┼────────────────────────┐
             │                        │                        │
   ┌─────────▼──────────┐  ┌─────────▼────────┐    ┌──────────▼─────────┐
   │  Connector Layer    │  │  Watch Engine     │    │  Postgres          │
   │  Logs + DB + Metrics│  │  Threshold Alerts │    │  (your databases)  │
   └─────────┬──────────┘  └─────────┬────────┘    └────────────────────┘
             │                        │
             └────────────┬───────────┘
                          │
           ┌──────────────▼───────────────────┐
           │       SQLite (WAL + FTS5)         │
           │  Logs │ Errors │ Watches │ Alerts │
           │  Metrics │ Sessions │ Journeys    │
           └──────────────────────────────────┘
Design decisions:
- SQLite — Zero dependencies. Single-file database with FTS5 for full-text log search.
- MCP-first — Every feature is an MCP tool, not just a REST endpoint. Tools include guided suggestions so AI assistants navigate workflows without prompt engineering.
- Read-only DB access — Queries against your Postgres are validated SELECT-only via SQL AST parsing.
- Single binary — Web server, MCP server, and VM agent in one binary. No runtime dependencies.
Documentation
| Doc | Description |
|---|---|
| MCP Integration | Setup for Claude Code, Cursor, Windsurf + full tool reference |
| API Reference | REST API endpoints, log fields, watch scheduling |
| Deployment Guide | Docker, cloud platforms, systemd, configuration |
| VM Agent | Server metrics agent setup and systemd service |
Development
go test -short -race ./...              # unit tests (no Docker)
go test -race ./...                     # full suite (needs Docker for Postgres)
OPENTRACE_DEV=true ./opentrace          # live template reload
See CONTRIBUTING.md for development setup and guidelines.