SQL Server Performance Monitor
Free, open-source monitoring that replaces the tools charging you thousands per server per year. 30+ collectors, real-time alerts, built-in MCP server for AI analysis. Nothing phones home. Your data stays on your server and your machine.
Supported: SQL Server 2016–2025 | Azure SQL Managed Instance | AWS RDS for SQL Server | Azure SQL Database (Lite only)
Download
👉 Not sure which edition to pick? Start with Lite. One download, nothing installed on your server, data flowing in under 5 minutes.
| Full Edition | Lite Edition | |
|---|---|---|
| What it does | Installs a PerformanceMonitor database with 30 T-SQL collectors running via SQL Agent. Separate dashboard app connects to view everything. | Single desktop app that monitors remotely. Stores data locally in DuckDB + Parquet. Nothing touches your server. |
| Best for | Production 24/7 monitoring, long-term baselining | Quick triage, Azure SQL DB, locked-down servers, consultants, firefighting |
| Requires | sysadmin + SQL Agent running | VIEW SERVER STATE (that's it) |
| Get started | Run the installer, open the dashboard | Download, run, add a server, done |
Both editions include real-time alerts (system tray + email), charts and graphs, dark and light themes, CSV export, and a built-in MCP server for AI-powered analysis with tools like Claude.
What People Are Saying
"You guys make us DBAs look like absolute rockstars. I'm over here getting showered with praise, and all I do is use your scripts and follow your advice."
"replaced SentryOne and had it running in 10 minutes"
"I've had enough time to gather data and converse with Claude on this. It helped a lot to zone in on CPU starvation from the hypervisor on which the VM runs. IT team currently investigating the host configuration."
What You Get
🔍 32 specialized T-SQL collectors running on configurable schedules — wait stats, query performance, blocking chains, deadlock graphs, memory grants, file I/O, tempdb, perfmon counters, and more. Query text and execution plan collection can be disabled per-collector for sensitive environments.
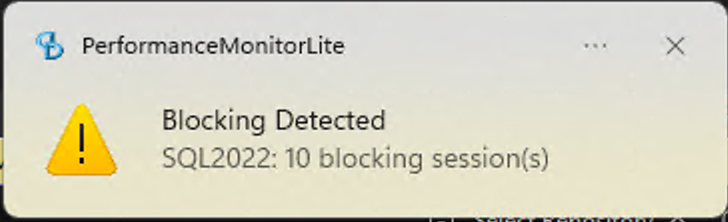
🚨 Real-time alerts for blocking, deadlocks, and high CPU — system tray notifications plus styled HTML emails with full XML attachments for offline analysis
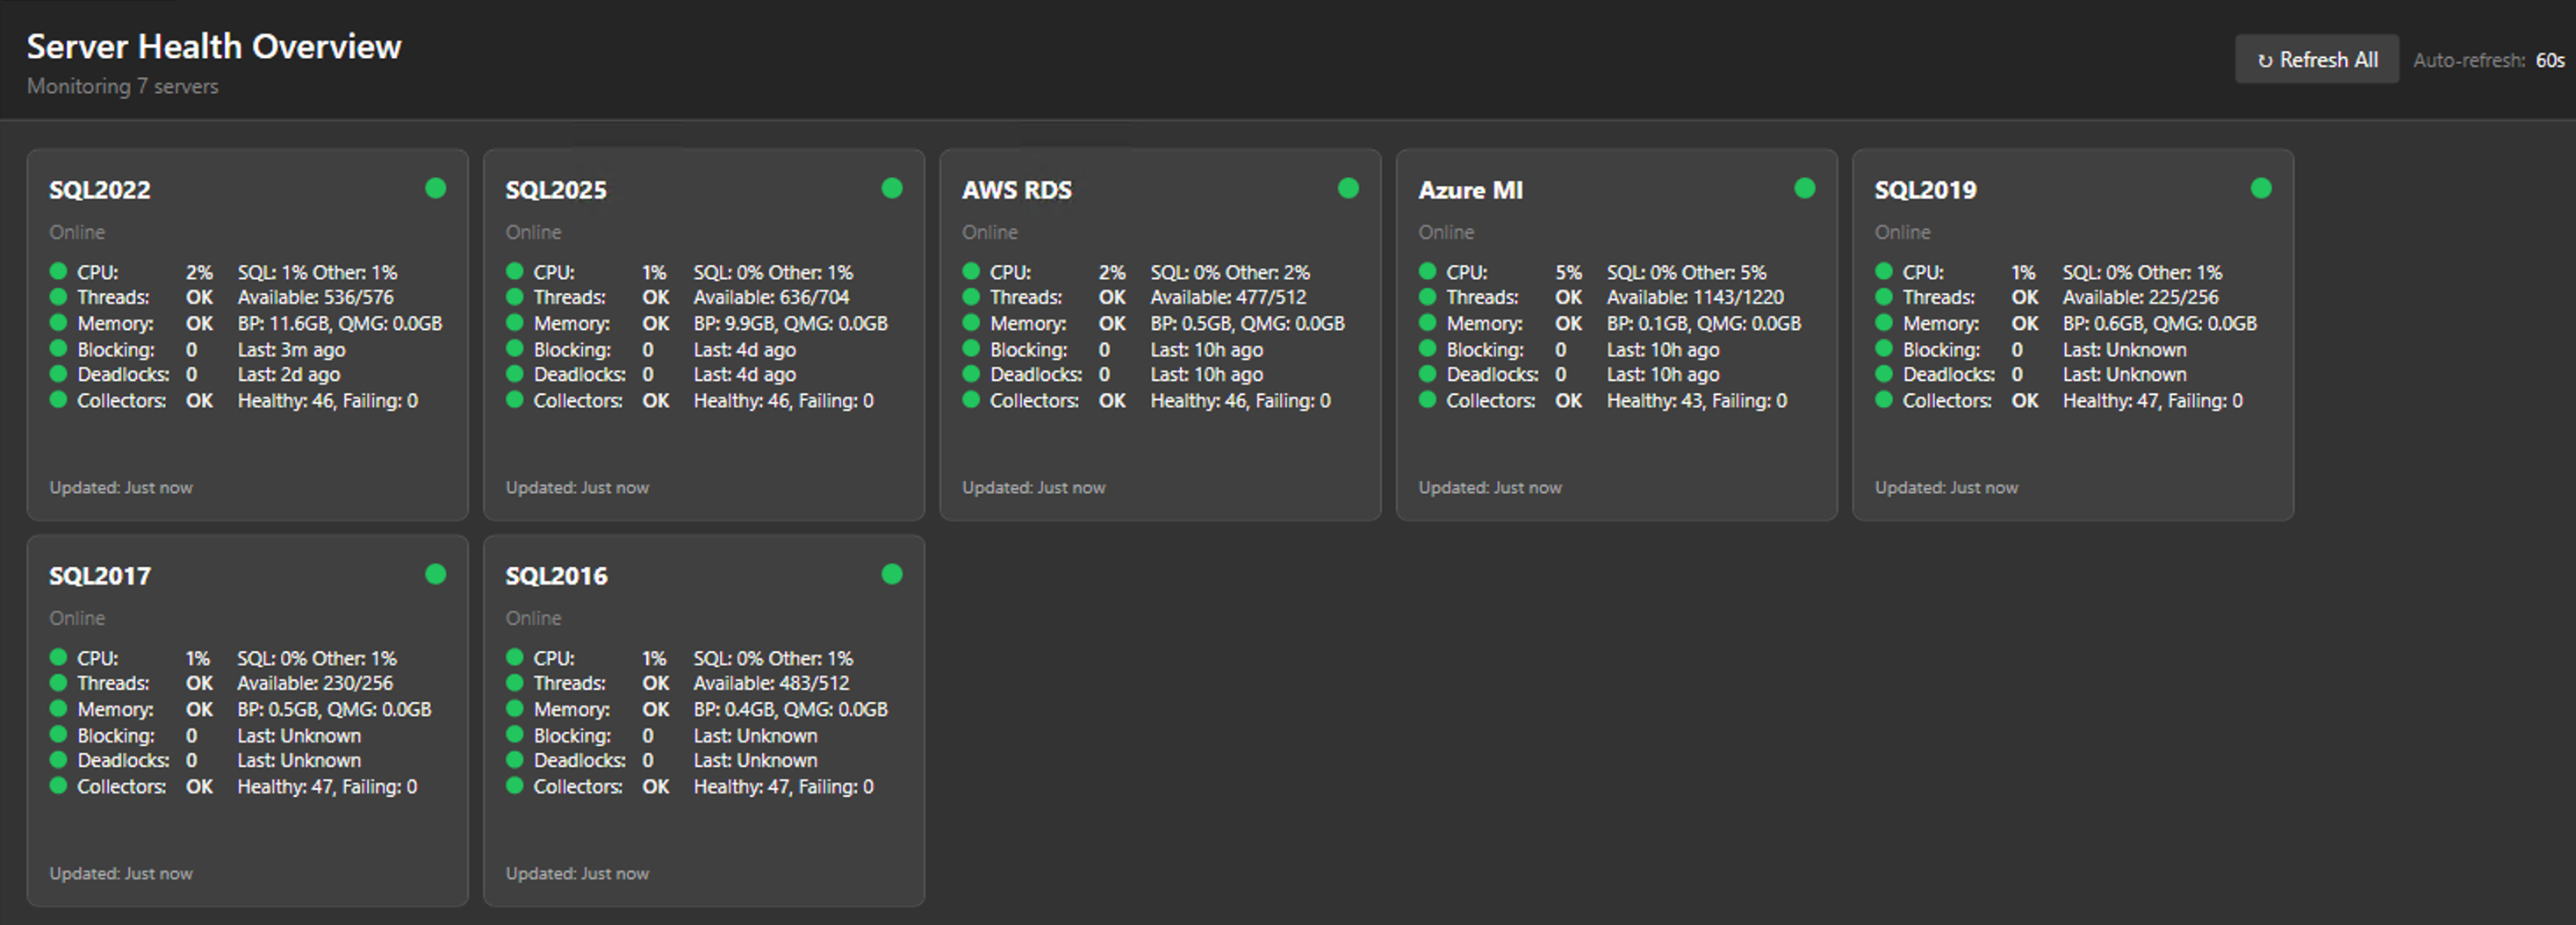
📊 NOC-style dashboard with green/yellow/red health cards, auto-refresh, configurable time ranges, and dark/light themes
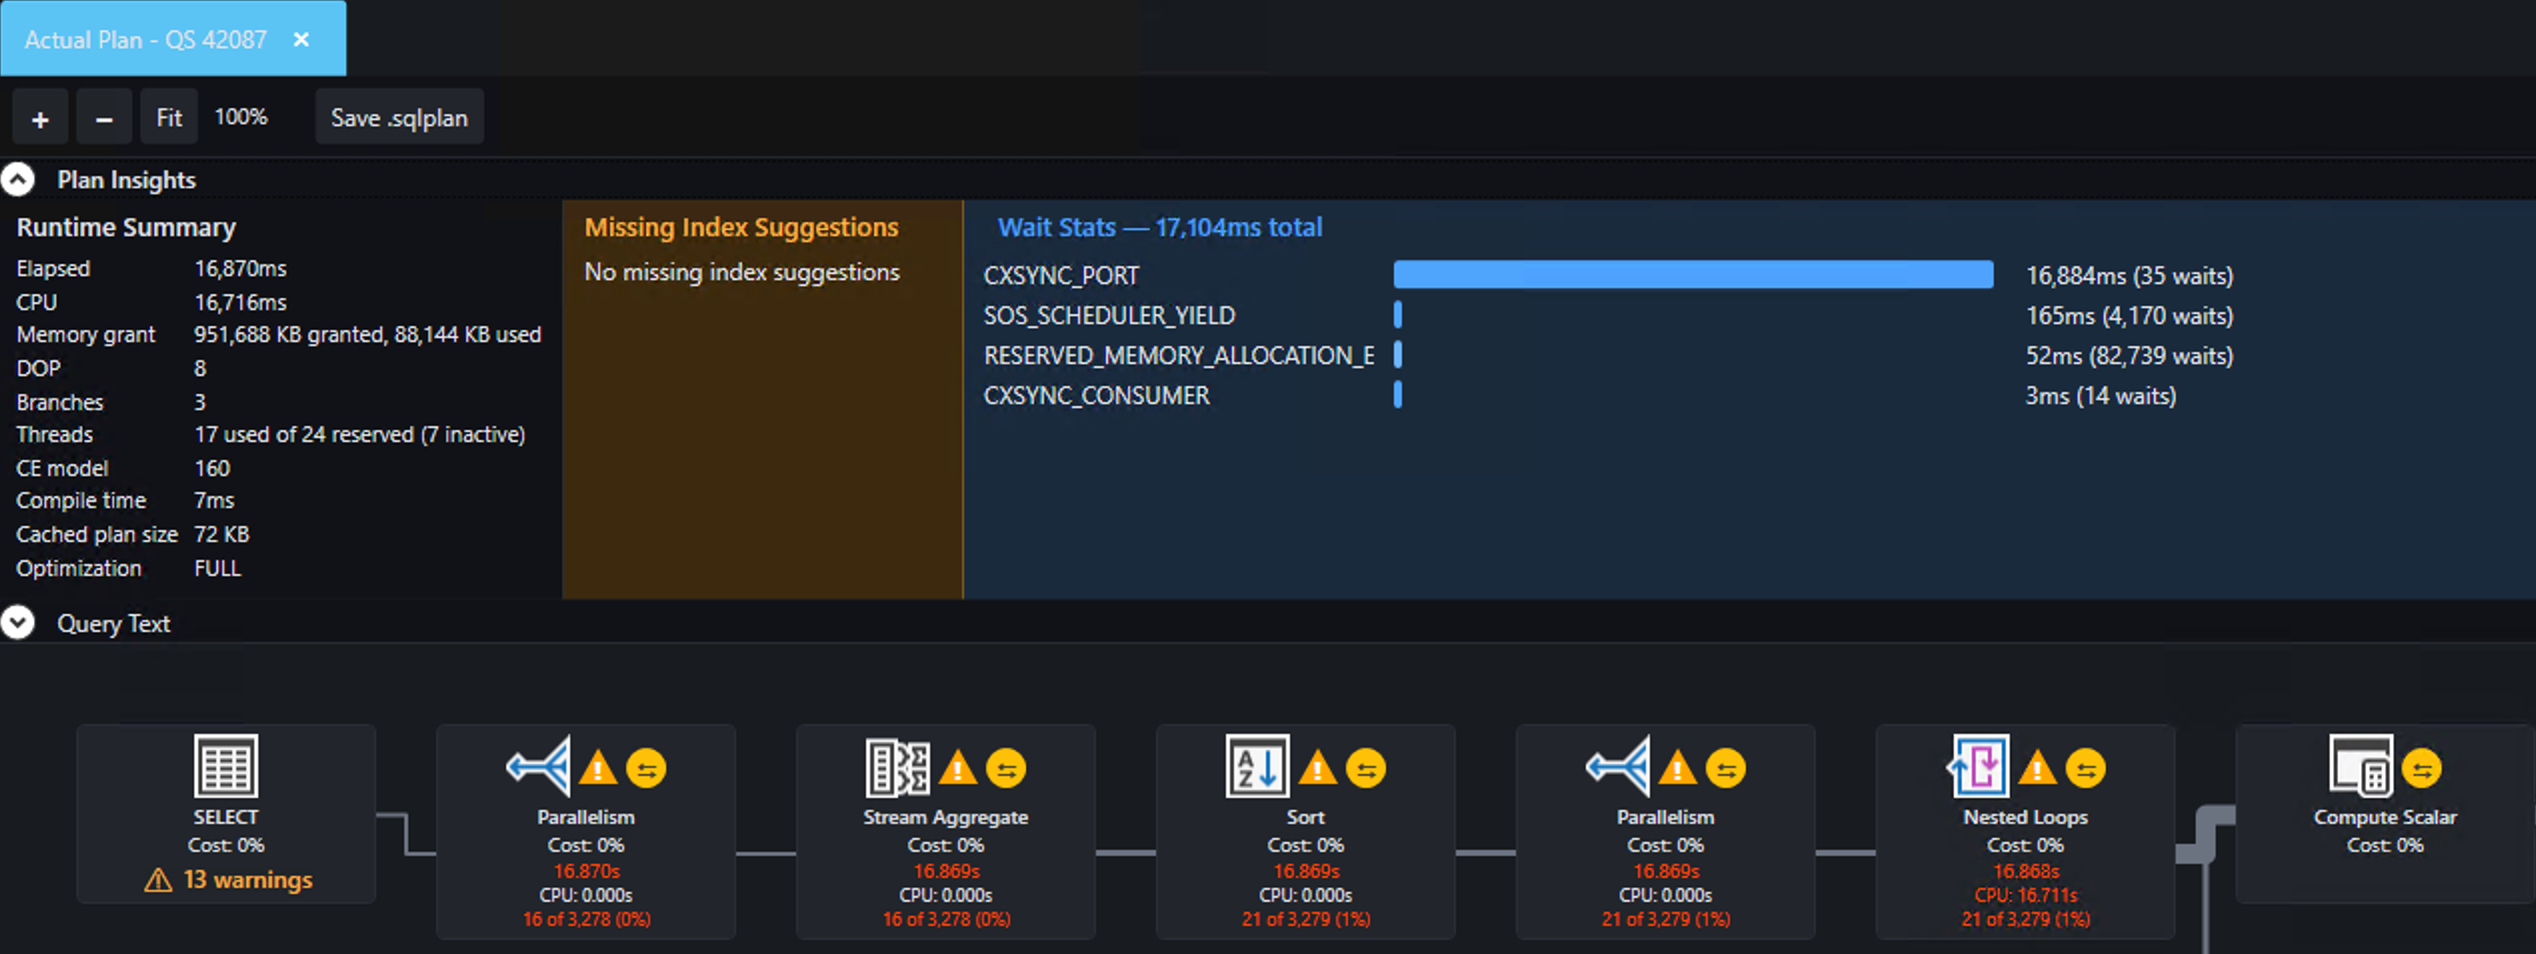
📋 Graphical plan viewer with native ShowPlan rendering, 30-rule PlanAnalyzer, operator-level cost breakdown, and a standalone mode for opening .sqlplan files without a server connection
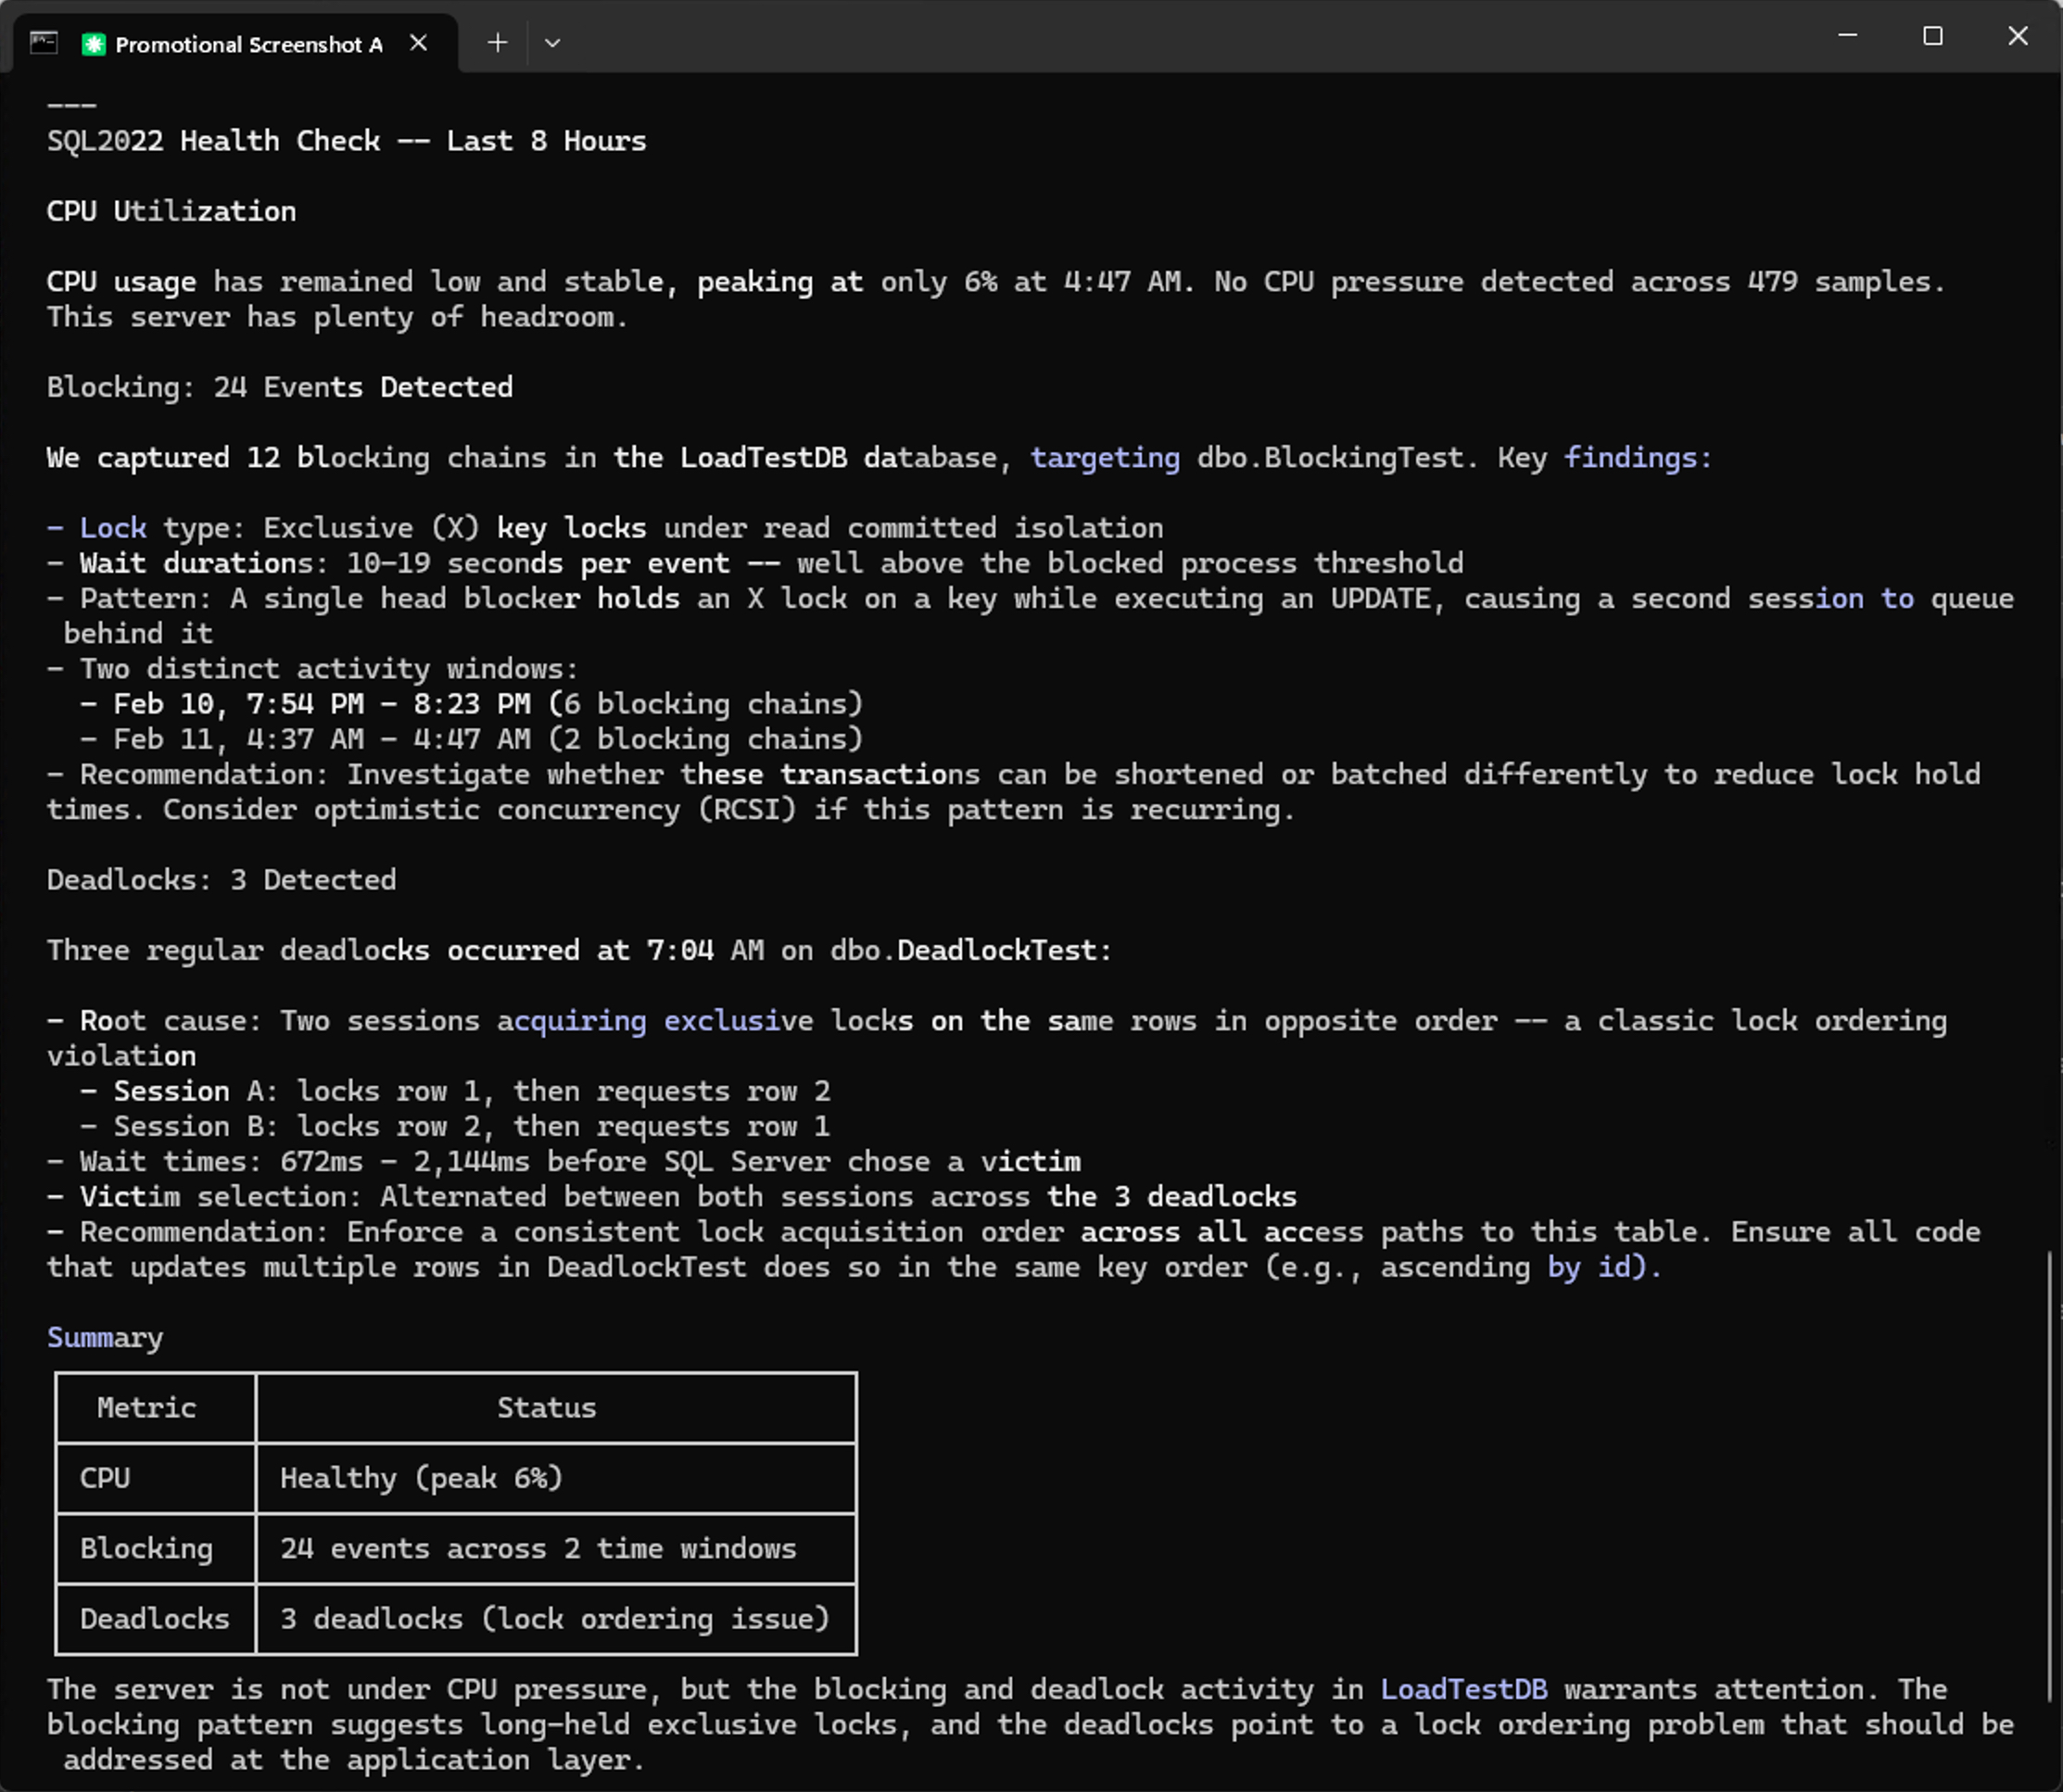
🤖 Built-in MCP server with 27-31 read-only tools for AI analysis — ask Claude Code or Cursor "what are the top wait types on my server?" and get answers from your actual monitoring data
🧰 Community tools installed automatically — sp_WhoIsActive, sp_BlitzLock, sp_HealthParser, sp_HumanEventsBlockViewer
🔒 Your data never leaves — no telemetry, no cloud dependency, no phoning home. Credentials stored in Windows Credential Manager with OS-level encryption.
More Screenshots
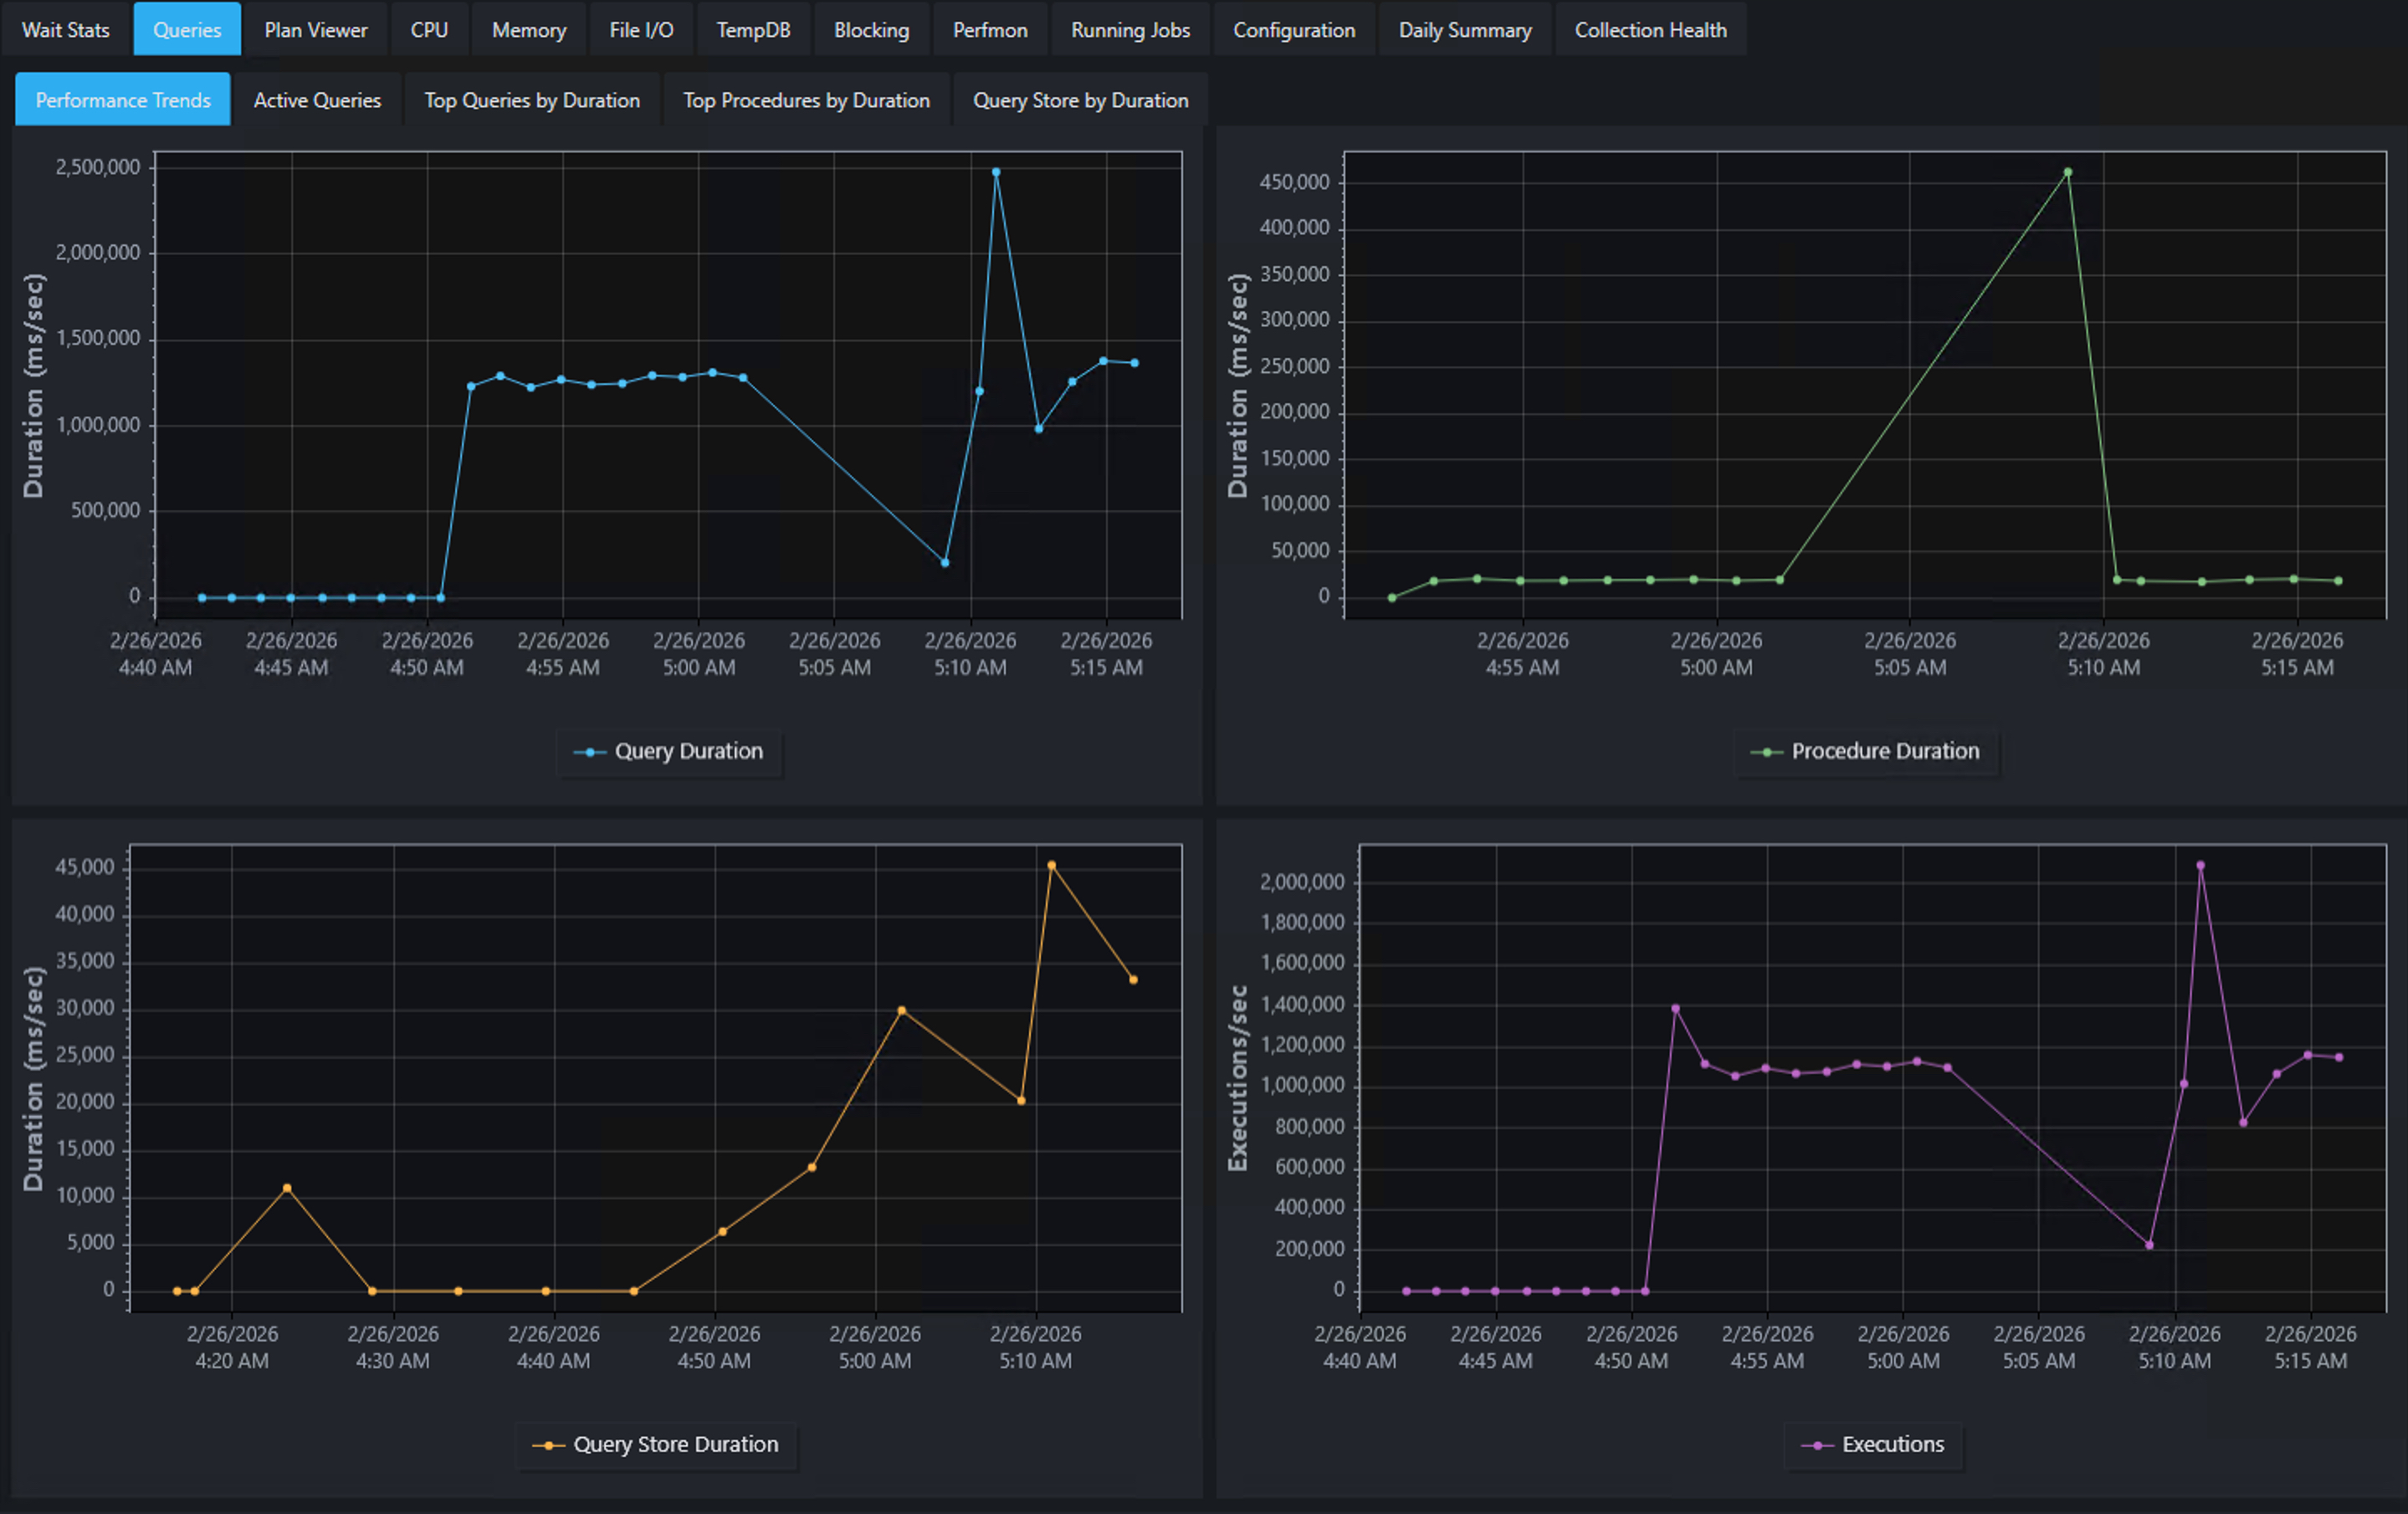
Lite Edition — Query Performance
Graphical Plan Viewer
Alert Notifications
MCP Server — AI-Powered Analysis
Quick Start — Lite Edition
- Download and extract PerformanceMonitorLite (requires .NET 8 Desktop Runtime)
- Run
PerformanceMonitorLite.exe - Click + Add Server, enter connection details, test, save
- Double-click the server in the sidebar to connect
Data starts flowing within 1–5 minutes. That's it. No installation on your server, no Agent jobs, no sysadmin required.
Lite Collectors
20 collectors run on independent, configurable schedules:
| Collector | Default | Source |
|---|---|---|
| query_snapshots | 1 min | sys.dm_exec_requests + sys.dm_exec_sessions |
| blocked_process_report | 1 min | XE ring buffer session |
| waiting_tasks | 1 min | sys.dm_os_waiting_tasks |
| wait_stats | 1 min | sys.dm_os_wait_stats (deltas) |
| query_stats | 1 min | sys.dm_exec_query_stats (deltas) |
| procedure_stats | 1 min | sys.dm_exec_procedure_stats (deltas) |
| cpu_utilization | 1 min | sys.dm_os_ring_buffers scheduler monitor |
| file_io_stats | 1 min | sys.dm_io_virtual_file_stats (deltas) |
| memory_stats | 1 min | sys.dm_os_sys_memory + memory counters |
| memory_grant_stats | 1 min | sys.dm_exec_query_memory_grants |
| tempdb_stats | 1 min | sys.dm_db_file_space_usage |
| perfmon_stats | 1 min | sys.dm_os_performance_counters (deltas) |
| deadlocks | 1 min | system_health Extended Events session |
| memory_clerks | 5 min | sys.dm_os_memory_clerks |
| query_store | 5 min | Query Store DMVs (per database) |
| running_jobs | 5 min | msdb job history with duration vs avg/p95 |
| server_config | On connect | sys.configurations |
| database_config | On connect | sys.databases |
| database_scoped_config | On connect | Database-scoped configurations |
| trace_flags | On connect | DBCC TRACESTATUS |
Lite Data Storage
- Hot data in DuckDB (7–90 days, configurable)
- Archive to Parquet with ZSTD compression (~10x reduction, 30–180 days configurable)
- Typical size: ~50–200 MB per server per week
Lite Configuration
All configuration lives in the config/ folder:
| File | Purpose |
|---|---|
servers.json | Server connections (passwords in Windows Credential Manager) |
settings.json | Retention, MCP server, startup behavior, alert thresholds, SMTP configuration |
collection_schedule.json | Per-collector enable/disable and frequency |
ignored_wait_types.json | 144 benign wait types excluded by default |
Quick Start — Full Edition
Install
Windows Authentication:
PerformanceMonitorInstaller.exe YourServerName
SQL Authentication:
PerformanceMonitorInstaller.exe YourServerName sa YourPassword
Clean reinstall (drops existing database and all collected data):
PerformanceMonitorInstaller.exe YourServerName --reinstall
PerformanceMonitorInstaller.exe YourServerName sa YourPassword --reinstall
The installer automatically tests the connection, executes SQL scripts, downloads community dependencies, creates SQL Agent jobs, and runs initial data collection. A GUI installer (InstallerGui/) is also available with the same functionality.
CLI Installer Options
| Option | Description |
|---|---|
SERVER | SQL Server instance name (positional, required) |
USERNAME PASSWORD | SQL Authentication credentials (positional, optional) |
--reinstall | Drop existing database and perform clean install |
--preserve-jobs | Keep existing SQL Agent job schedules during upgrade |
--encrypt=optional|mandatory|strict | Connection encryption level (default: mandatory) |
--trust-cert | Trust server certificate without validation (default: require valid cert) |
--help | Show usage information and exit |
Environment variable: Set PM_SQL_PASSWORD to avoid passing the password on the command line.
Exit Codes
| Code | Meaning |
|---|---|
0 | Success |
1 | Invalid arguments |
2 | Connection failed |
3 | Critical file failed (scripts 01–03) |
4 | Partial installation (non-critical failures) |
5 | Version check failed |
6 | SQL files not found |
Post-Installation
- Ensure SQL Server Agent is running — the collection job executes every minute
- Verify installation:
SELECT * FROM PerformanceMonitor.config.current_version;

SELECT TOP (20) *
FROM PerformanceMonitor.config.collection_log
ORDER BY collection_time DESC;
- Launch the Dashboard (
Dashboard/folder — build withdotnet buildor use the release package). The Dashboard is a separate WPF application that runs on your workstation and connects to any SQL Server where the PerformanceMonitor database is installed. Add your server, enter credentials, and data appears immediately.
What Gets Installed
- PerformanceMonitor database with collection tables and reporting views
- 32 collector stored procedures for gathering metrics (including SQL Agent job monitoring)
- Configurable collection — query text and execution plan capture can be disabled per-collector via
config.collection_schedule(collect_query,collect_plancolumns) for sensitive or high-volume environments - Delta framework for calculating per-second rates from cumulative DMVs
- Community dependencies: sp_WhoIsActive, sp_HealthParser, sp_HumanEventsBlockViewer, sp_BlitzLock
- SQL Agent jobs: Collection (every 1 minute), Data Retention (daily at 2:00 AM), and Hung Job Monitor (collection job watchdog, every 5 minutes)
- Version tracking in
config.installation_history
Data Retention
Default: 30 days (configurable per table in config.retention_settings).
Storage estimates: 5–10 GB per week, 20–40 GB per month.
Managed Platform Support
The Full Edition supports Azure SQL Managed Instance and AWS RDS for SQL Server with some limitations:
| Feature | On-Premises | Azure SQL MI | AWS RDS |
|---|---|---|---|
| All core collectors | Yes | Yes | Yes |
| Default trace collectors | Yes | Disabled automatically | Yes |
| System health XE (file target) | Yes | Disabled automatically | Yes |
| SQL Trace collectors | Yes | Disabled automatically | Yes |
| SQL Agent jobs | Yes | Yes | Yes |
| Running jobs collector | Yes | Yes | Disabled automatically |
| Blocked process threshold | Auto-configured | Auto-configured | Configure via RDS parameter group |
| sp_configure | Yes | Yes | Not available |
Azure SQL MI: The installer automatically detects Engine Edition 8 and disables 4 collectors that require file system access or SQL Trace (default_trace, trace_management, trace_analysis, system_health). All other collectors work normally.
AWS RDS: The installer automatically detects the rdsadmin database and disables the running_jobs_collector (requires msdb.dbo.syssessions which is restricted on RDS). It also gracefully handles restricted sp_configure and limited msdb permissions. SQL Agent jobs are created and owned by the installing login. The RDS master user is automatically enrolled in SQLAgentUserRole; for other logins, add them to SQLAgentUserRole in msdb before running the installer.
AWS RDS Parameter Group Configuration
sp_configure is not available on AWS RDS for SQL Server. Features that depend on server-level configuration must be set through AWS RDS Parameter Groups instead.
Blocked process threshold — Required for blocked process report collection. Without this, blocked process reports will not fire on RDS.
-
Open the AWS RDS Console and navigate to Parameter groups
-
Create a new parameter group (or modify the one attached to your instance):
- Family:
sqlserver-ee-16.0(or your edition/version) - Type: DB Parameter Group
- Family:
-
Search for
blocked process threshold (s)and set it to5(seconds) -
Apply the parameter group to your RDS instance (may require a reboot if the parameter is static)
-
Verify it took effect:
SELECT
    c.name,
    c.value_in_use
FROM sys.configurations AS c
WHERE c.name = N'blocked process threshold (s)';
Deadlocks — No parameter group configuration is required. The SQL Server deadlock monitor runs automatically on all platforms, and the xml_deadlock_report Extended Event fires without any threshold setting.
Azure SQL Database — The blocked process threshold is fixed at 20 seconds and cannot be changed. The blocked_process_report event fires automatically when blocking exceeds this duration.
Edition Comparison
| Capability | Full | Lite |
|---|---|---|
| Target server installation | Required | None |
| SQL Server Agent | Required | Not needed |
| Azure SQL Managed Instance | Supported | Supported |
| AWS RDS for SQL Server | Supported | Supported |
| Azure SQL Database | Not supported | Supported |
| Multi-server from one seat | Per-server install | Built-in |
| Collectors | 32 | 20 |
| Agent job monitoring | Duration vs historical avg/p95 | Duration vs historical avg/p95 |
| Data storage | SQL Server (on target) | DuckDB + Parquet (local) |
| Execution plans | Collected and stored (can be disabled per-collector) | Download on demand |
| Graphical plan viewer | Built-in with 30-rule PlanAnalyzer | Built-in with 30-rule PlanAnalyzer |
| Standalone plan viewer | Open/paste/drag .sqlplan files | Open/paste/drag .sqlplan files |
| Community tools (sp_WhoIsActive, sp_BlitzLock) | Installed automatically | Not needed |
| Alerts (tray + email) | Blocking, deadlocks, CPU | Blocking, deadlocks, CPU |
| Dashboard | Separate app | Built-in |
| Themes | Dark and light | Dark and light |
| Portability | Server-bound | Single executable |
| MCP server (LLM integration) | Built into Dashboard (27 tools) | Built-in (31 tools) |
Dashboard Tabs
Full Edition Dashboard
| Tab | Contents |
|---|---|
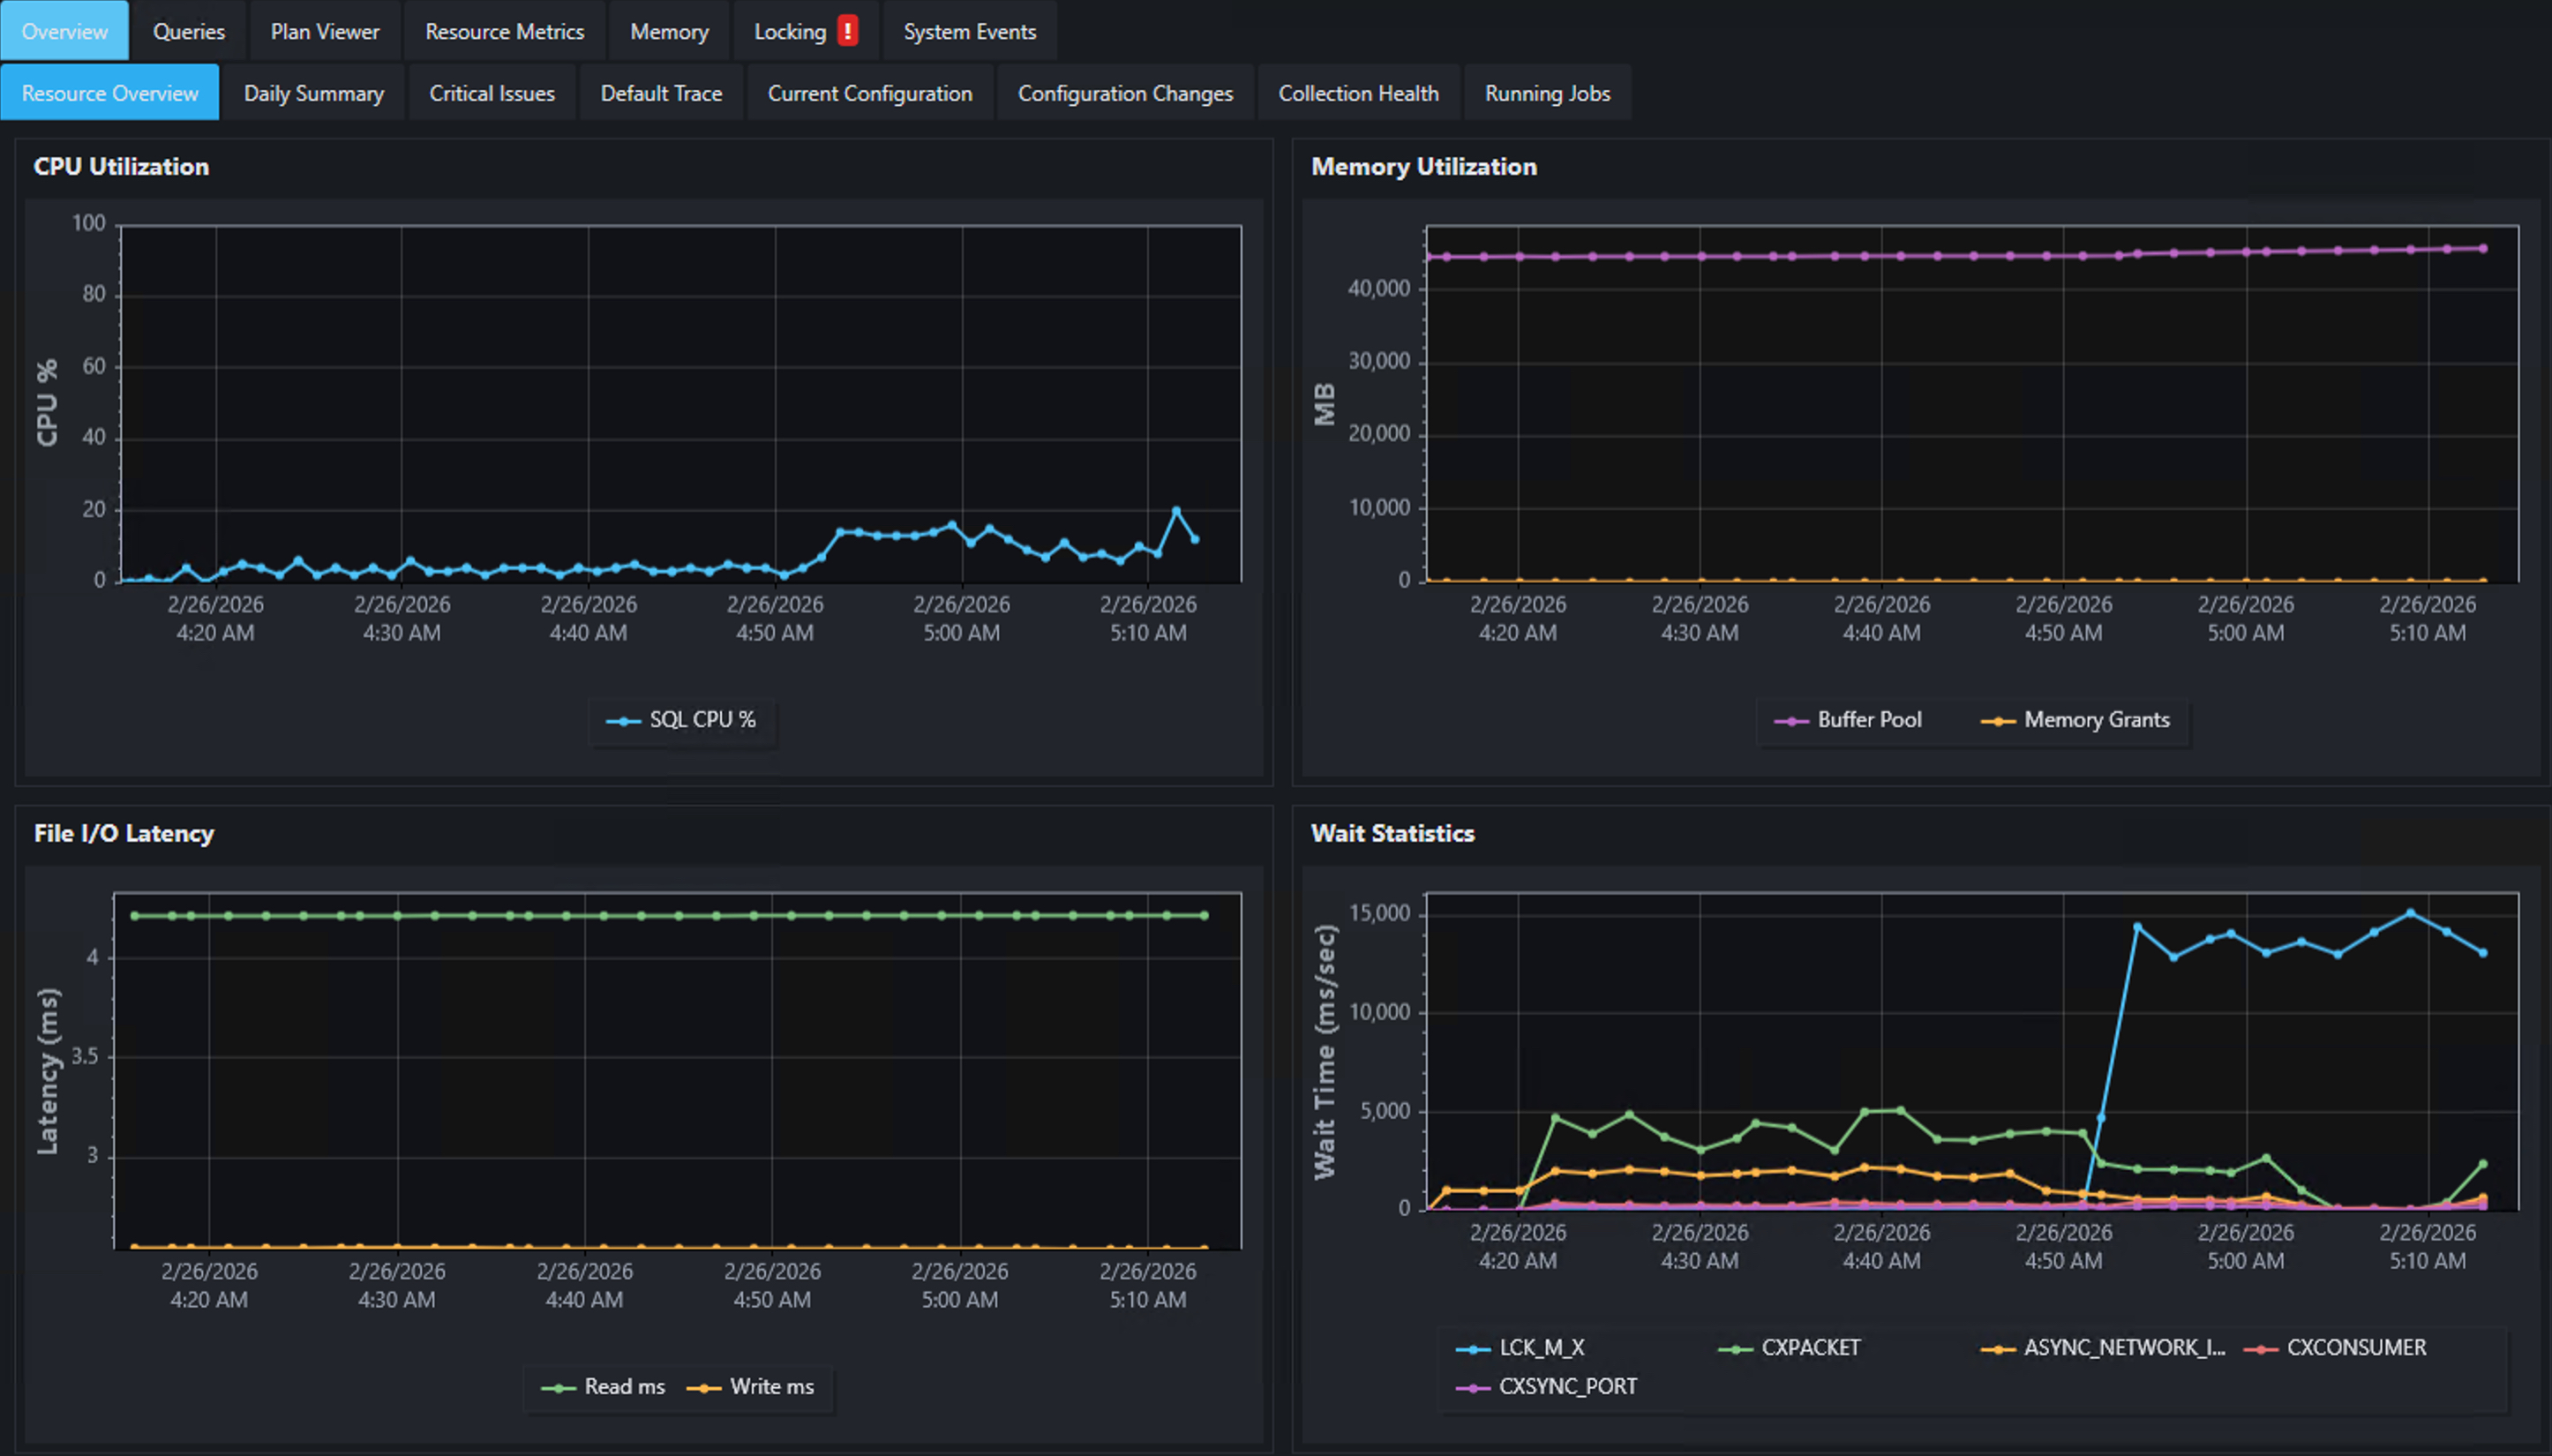
| Overview | Resource overview, daily summary, critical issues, server config changes, database config changes, trace flag changes, collection health |
| Performance | Performance trends, expensive queries, active queries, query stats, procedure stats, Query Store, Query Store regressions, query trace patterns |
| Resource Metrics | Server trends, wait stats, TempDB, file I/O latency, perfmon counters, default trace events, trace analysis, session stats, latch stats, spinlock stats |
| Memory | Memory overview, grants, clerks, plan cache, memory pressure events |
| Locking | Blocking chains, deadlocks, blocking/deadlock trends |
| System Events | Corruption events, contention, errors, I/O issues, scheduler issues, memory conditions |
Plus a NOC-style landing page with server health cards (green/yellow/red severity indicators).
Lite Edition Dashboard
| Tab | Contents |
|---|---|
| Active Queries | Running queries with session details, wait types, blocking, DOP, memory grants |
| Wait Stats | Filterable wait statistics chart with delta calculations |
| CPU | SQL Server CPU vs Other Processes over time |
| Memory | Physical memory overview, SQL Server memory trend, memory clerk breakdown |
| Queries | Performance trends, top queries and procedures by duration, Query Store integration |
| File I/O | Read/write I/O trends per database file |
| TempDB | Space usage breakdown and TempDB file I/O |
| Blocking | Blocking/deadlock trends, blocked process reports, deadlock history |
| Perfmon | Selectable SQL Server performance counters over time |
| Configuration | Server configuration, database configuration, scoped configuration, trace flags |
Both editions feature auto-refresh, configurable time ranges, right-click CSV export, system tray integration, dark and light themes, and timezone display options (server time, local time, or UTC).
Alerts & Notifications
Both editions include a real-time alert engine that monitors for performance issues and sends notifications via system tray balloons and email.
Alert Types
| Metric | Default Threshold | Description |
|---|---|---|
| Blocking | 30 seconds (Full), 5 seconds (Lite) | Fires when the longest blocked session exceeds the threshold |
| Deadlocks | 1 | Fires when new deadlocks are detected since the last check |
| High CPU | 90% (Full), 80% (Lite) | Fires when total CPU (SQL + other) exceeds the threshold |
| Connection changes | N/A | Fires when a monitored server goes offline or comes back online |
All thresholds are configurable in Settings.
Notification Channels
- System tray — balloon notifications with 5-minute per-metric cooldown
- Email (SMTP) — styled HTML emails with 15-minute per-metric cooldown, configurable SMTP settings (server, port, SSL, authentication, recipients)
Email Alerts
Alert emails include:
- Metric summary — what triggered the alert, current value vs threshold
- Detail section — recent blocking chains or deadlock participants with query text, wait times, lock modes, database names, and client application
- XML attachment — full
blocked_process_report.xmlordeadlock_graph.xmlfor offline analysis
Alert Behavior
- Resolved notifications — when a condition clears (e.g., blocking ends), a "Cleared" notification fires
- Server silencing — right-click a server tab to acknowledge alerts, silence all alerts, or unsilence
- Always-on — the Dashboard alert engine runs independently of which tab is active, including when minimized to the system tray. The Lite edition's alert engine also runs regardless of tab visibility.
- Alert history — Dashboard keeps an in-memory alert log (accessible via MCP). Lite logs alerts to DuckDB (
config_alert_log).
Agent Job Monitoring
Both editions monitor currently running SQL Agent jobs and flag jobs that are running longer than expected.
| Metric | How It Works |
|---|---|
| Current duration | Elapsed time since the job started |
| Average duration | Historical mean from successful completions in msdb.dbo.sysjobhistory |
| p95 duration | 95th percentile from historical completions |
| Running long flag | Set when current duration exceeds the p95 threshold |
The Full Edition collects this data via the collect.running_jobs_collector stored procedure (every 5 minutes). The Lite Edition queries msdb directly on each collection cycle. Both editions expose this data through the MCP get_running_jobs tool.
Gracefully skipped on Azure SQL Database, AWS RDS for SQL Server, and environments without SQL Server Agent.
MCP Server (LLM Integration)
Both editions include an embedded Model Context Protocol server that exposes monitoring data to LLM clients like Claude Code and Cursor.
Setup
- Enable the MCP server in Settings (checkbox + port, default
5151) - Register with Claude Code:
claude mcp add --transport http --scope user sql-monitor http://localhost:5151/
- Open a new Claude Code session and ask questions like:
- "What servers are being monitored?"
- "What are the top wait types on my server?"
- "Are there any blocking or deadlock issues?"
- "Show me CPU utilization for the last 4 hours"
- "What are the most expensive queries by CPU?"
Available Tools
Full Edition exposes 27 tools, Lite Edition exposes 31. Core tools are shared across both editions.
| Category | Tools |
|---|---|
| Discovery | list_servers |
| Health | get_server_summary*, get_daily_summary**, get_collection_health |
| Alerts | get_alert_history, get_alert_settings |
| Waits | get_wait_stats, get_wait_types*, get_wait_trend, get_waiting_tasks* |
| Queries | get_top_queries_by_cpu, get_top_procedures_by_cpu, get_query_store_top, get_expensive_queries**, get_query_duration_trend*, get_query_trend |
| CPU | get_cpu_utilization |
| Memory | get_memory_stats, get_memory_trend, get_memory_clerks, get_memory_grants |
| Blocking | get_blocking**, get_deadlocks, get_deadlock_detail, get_blocked_process_reports*, get_blocked_process_xml, get_blocking_deadlock_stats**, get_blocking_trend*, get_deadlock_trend* |
| I/O | get_file_io_stats, get_file_io_trend |
| TempDB | get_tempdb_trend |
| Perfmon | get_perfmon_stats, get_perfmon_trend |
| Jobs | get_running_jobs* |
* Lite only | ** Full only
Most tools accept optional server_name and hours_back parameters. If only one server is configured, server_name is auto-resolved.
The MCP server binds to localhost only and does not accept remote connections.
Performance Impact
On Monitored Servers
- All queries use
READ UNCOMMITTEDisolation - Configurable collection intervals
- Full Edition: typical overhead <1% CPU, <100 MB memory
- Lite Edition: max 7 concurrent SQL connections, 30-second command timeout
Local Resources (Lite)
- DuckDB: ~50–200 MB per server per week
- Parquet archives: ~10x compression with ZSTD
- ScottPlot charts use hardware-accelerated rendering
Troubleshooting
Full Edition
Two diagnostic scripts in the install/ folder:
| Script | Purpose |
|---|---|
99_installer_troubleshooting.sql | Quick health checks: collection log errors, schedule status, Agent job status, table row counts |
99_user_troubleshooting.sql | Comprehensive diagnostics: runs collectors with @debug = 1, detailed timing and row counts |
SELECT
    collection_time,
    collector_name,
    error_message
FROM PerformanceMonitor.config.collection_log
WHERE collection_status = 'ERROR'
ORDER BY collection_time DESC;
Lite Edition
Application logs are written to the logs/ folder. Collection success/failure is also logged to the collection_log table in DuckDB.
Common issues:
- No data after connecting — Wait for the first collection cycle (1–5 minutes). Check logs for connection errors.
- Query Store tab empty — Query Store must be enabled on the target database (
ALTER DATABASE [YourDB] SET QUERY_STORE = ON). - Blocked process reports empty — Both editions attempt to auto-configure the blocked process threshold to 5 seconds via
sp_configure. On AWS RDS,sp_configureis not available — you must setblocked process threshold (s)through an RDS Parameter Group (see "AWS RDS Parameter Group Configuration" above). On Azure SQL Database, the threshold is fixed at 20 seconds and cannot be changed. If you still see no data on other platforms, verify the login hasALTER SETTINGSpermission. - Connection failures — Verify network connectivity, firewall rules, and that the login has
VIEW SERVER STATE.
Folder Structure
Monitor/
│
│   Full Edition (server-installed collectors + separate dashboard)
├── install/          # 54 SQL installation scripts
├── upgrades/         # Version-specific upgrade scripts
├── Installer/        # CLI installer for Full Edition database (C#)
├── InstallerGui/     # GUI installer for Full Edition database (WPF)
├── Dashboard/        # Full Edition dashboard application (WPF)
│
│   Lite Edition (standalone desktop app, nothing installed on server)
├── Lite/             # Lite Edition desktop application (WPF)
│
│   Shared
└── README.md         # This file
Building from Source
All projects target .NET 8.0.
# Full Edition Dashboard
dotnet build Dashboard/Dashboard.csproj

# Lite Edition
dotnet build Lite/PerformanceMonitorLite.csproj

# CLI Installer (self-contained)
dotnet publish Installer/PerformanceMonitorInstaller.csproj -c Release

# GUI Installer
dotnet publish InstallerGui/InstallerGui.csproj -c Release -r win-x64 --self-contained
Support & Sponsorship
This project is free and open source. If you find it valuable, consider supporting continued development:
| Sponsor on GitHub | Become a sponsor to fund new features, ongoing maintenance, and SQL Server version support. |
| Consulting Services | Hire me for hands-on consulting if you need help analyzing the data this tool collects? Want expert assistance fixing the issues it uncovers? |
Neither is required — use the tool freely. Sponsorship and consulting keep this project alive.
Third-Party Components
sp_WhoIsActive
- Author: Adam Machanic | License: GPLv3
- Repository: https://github.com/amachanic/sp_whoisactive
DarlingData
- Author: Erik Darling (Darling Data, LLC) | License: MIT
- Repository: https://github.com/erikdarlingdata/DarlingData
SQL Server First Responder Kit
- Author: Brent Ozar Unlimited | License: MIT
- Repository: https://github.com/BrentOzarULTD/SQL-Server-First-Responder-Kit
See THIRD_PARTY_NOTICES.md for complete license texts.
License
Copyright (c) 2026 Darling Data, LLC. Licensed under the MIT License. See LICENSE for details.
Author
Erik Darling — erikdarling.com — Darling Data, LLC