visualizer-mcp
visualizer-mcp is a Model Context Protocol (MCP) server that connects AI assistants to Siemens Questa Visualizer through the Visualizer Command Channel (VCC) TCP interface. It lets Claude Code control a live simulation in natural language: opening waveforms, running the design, examining signal values, and searching signal histories across time. Visualizer is supplied with all Questa versions except OEM versions(?).
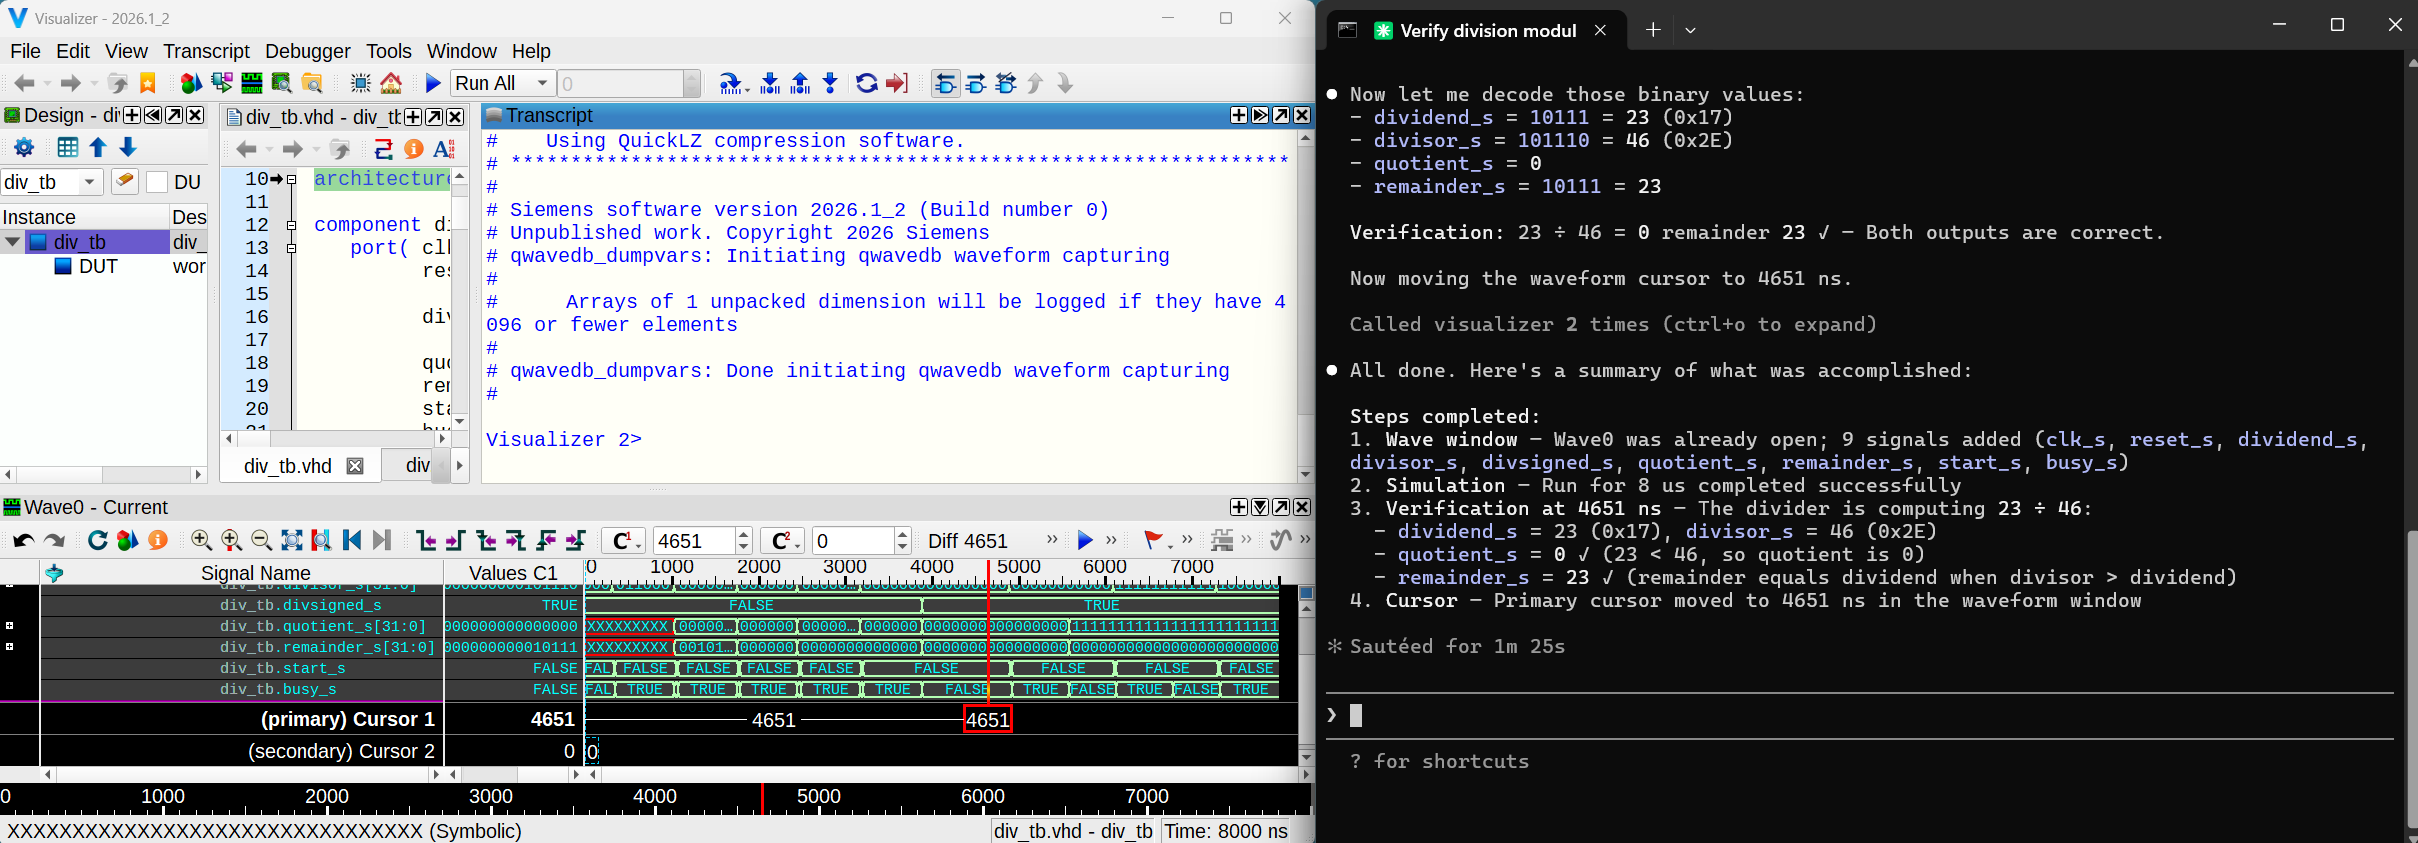
Figure: Running Visualizer_mcp
Prerequisites
| Tool | Purpose | Notes |
|---|---|---|
| Python 3.10+ | Runs the MCP server | python.org |
| uv | Installs the server via uvx (no manual venv) | docs.astral.sh/uv |
| Siemens Visualizer | The simulation GUI that the server controls | visualizer must be on PATH |
| Claude Code | The AI assistant that issues tool calls | claude.ai/code |
Note other LLM's should work as well but I am using Claude code (subscription).
Installation
Linux
# 1. Install uv (skip if already installed)
curl -LsSf https://astral.sh/uv/install.sh | sh
source $HOME/.local/bin/env    # reload PATH

# 2. Register visualizer-mcp with Claude Code
claude mcp add visualizer -- \
  uvx --from git+https://github.com/htminuslab/visualizer-mcp visualizer-mcp
Windows (PowerShell)
# 1. Install uv (skip if already installed)
powershell -ExecutionPolicy ByPass -c "irm https://astral.sh/uv/install.ps1 | iex"

# 2. Register visualizer-mcp with Claude Code
claude mcp add visualizer -- `
  uvx --from git+https://github.com/htminuslab/visualizer-mcp visualizer-mcp
Verify the registration:
claude mcp list
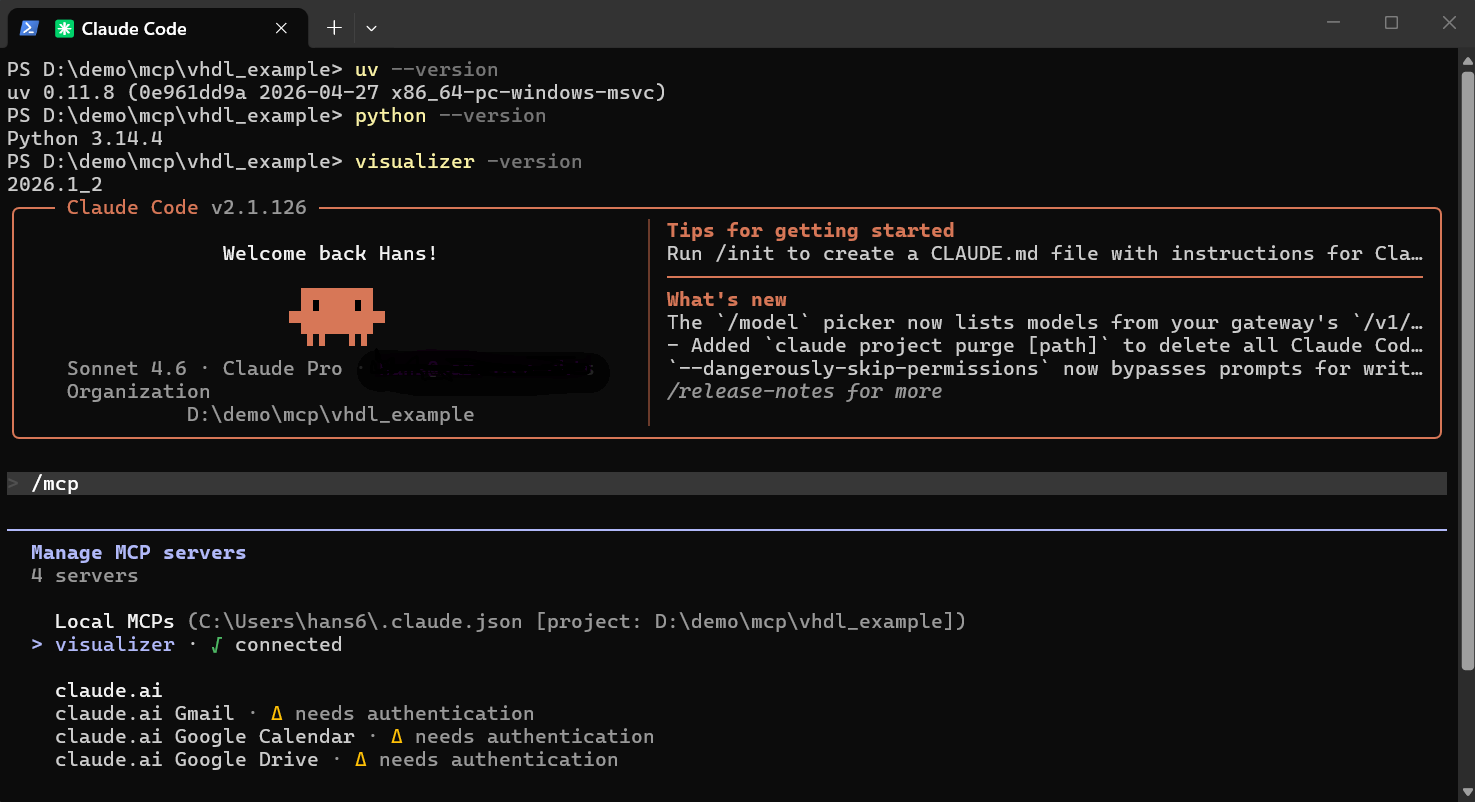
Figure: Doing some checks
Working directory. By default the server looks for Visualizer's connection file (
.Visualizer/vccserver.cfg) relative to its own working directory, which is the directory from which you launchedclaude. Launch both Visualizer and Claude Code from the same simulation directory and no further configuration is needed. If they differ, setVCC_WORK_DIR— see Environment variables.
How it works
Claude Code ──stdio──► visualizer-mcp ──TCP──► Visualizer GUI
  (LLM host)   (MCP)   (this server)   (VCC)  (Siemens EDA)
Claude Code launches visualizer-mcp as a child process over stdio (the standard MCP transport). The server keeps one persistent TCP connection to the Visualizer Command Channel (VCC) server, which starts automatically inside every Visualizer session.
Connection sequence:
- On the first tool call the server reads
$VCC_WORK_DIR/.Visualizer/vccserver.cfg. Visualizer writes this file at startup; it contains the VCC host and port in the formport@hostname. - The server opens a TCP socket, sends
vccRegisterClient, and subscribes tovDesignStateChange,vTimeChange, andvHierarchyChangenotifications. - Each tool call encodes a Tcl command into a VCC frame (10-byte header + brace-delimited body), sends it over the socket, and waits for the matching reply frame. Frames are matched to callers by an incrementing message number.
- Async signal notifications (e.g. time changes, design state changes) arrive as unsolicited
s-type frames and are stored in a 256-entry ring buffer, readable viavcc_recent_signals. - If Visualizer closes and the socket drops, the server reconnects (or auto-launches Visualizer) on the next tool call.
Every Visualizer Tcl command described in the Visualizer Debug Environment Command Reference Manual — run, step, wave add, examine, force, env, and hundreds more — is available through the vcc_eval escape hatch.
MCP tools
All tools return {"ok": true, "result": "..."} on success or {"ok": false, "error": "..."} on failure.
| Tool | Description |
|---|---|
vcc_connect | Connect to Visualizer (auto-launch if needed). Idempotent. |
vcc_status | Report cfg file presence, host/port, and connection state. Does not connect. |
vcc_eval | Send any Tcl command verbatim — the full Visualizer command set is accessible here. |
vcc_run | Advance simulation: "100ns", "8 us", "-all", or omit for a default step. |
vcc_step | Single-step the simulator N delta cycles. |
vcc_run_status | Return the current simulator run state. |
vcc_get_time | Return the current simulation time. |
vcc_wave_add | Add one or more signals to the wave window by hierarchical path. |
vcc_force | Force a signal to a value, optionally at a specific simulation time. |
vcc_examine | Read a signal's value at the current or a specified simulation time. |
vcc_scan_signal | Scan a signal across a time range; optionally search for a specific value. |
vcc_recent_signals | Return the most recent async signal notifications from Visualizer. |
Environment variables
| Variable | Default | Description |
|---|---|---|
VCC_WORK_DIR | server CWD | Directory whose .Visualizer/vccserver.cfg is read; also the CWD when auto-launching Visualizer. |
VCC_CFG_FILE | (unset) | Explicit path to the cfg file; overrides VCC_WORK_DIR lookup. Mirrors Visualizer's -vccfile flag. |
VCC_CLIENT_NAME | Claude-MCP | Name sent with vccRegisterClient. |
VCC_VISUALIZER_BIN | visualizer | Binary used when auto-launching Visualizer. |
VCC_LAUNCH_TIMEOUT_S | 60 | Seconds to wait for the cfg file after spawning Visualizer. |
VCC_CMD_TIMEOUT_S | 30 | Per-command timeout in seconds. |
To set an environment variable when registering the server:
# Linux
claude mcp add visualizer \
  -e VCC_WORK_DIR=/path/to/sim \
  -- uvx --from git+https://github.com/htminuslab/visualizer-mcp visualizer-mcp

# Windows
claude mcp add visualizer `
  -e "VCC_WORK_DIR=C:\path\to\sim" `
  -- uvx --from git+https://github.com/htminuslab/visualizer-mcp visualizer-mcp
Example: VHDL divider simulation
The vhdl_example/ directory contains a 32-bit non-restoring integer divider (div.vhd) and a testbench (div_tb.vhd). The testbench exercises both unsigned and signed division across several operand pairs. This walkthrough shows how to use Claude Code to compile, simulate, and interrogate the design.
1. Launch Visualizer
Open a terminal/CMD prompt, change to vhdl_example/, and start Visualizer with:
cd vhdl_example
visualizer -do run.do
run.do compiles the VHDL sources, optimises the design to div_tb_vopt and loads it into the simulator with vsim -visualizer. The Visualizer GUI appears with the simulation paused at time 0.
2. Start Claude Code and verify the MCP server
Open a new terminal in the same vhdl_example/ directory and start Claude Code:
cd vhdl_example
claude
Inside Claude Code, type the following command to confirm the MCP server is connected:
/mcp
You should see visualizer listed as a connected server. You can also ask Claude directly:
Are the Visualizer MCP tools available?
Claude will confirm and list the available tools.
The Visualizer transcript window should list the VCC server connection:
# Loading std.standard
# Loading std.textio(body)
# Loading ieee.std_logic_1164(body)
# Loading ieee.numeric_std(body)
# Loading work.div_tb(rtl)#1

# 18:09:53: Loading design data...
# 18:09:53: Loaded  design units
# 18:09:53: Loaded  design hierarchy
# 1

# VCC server established connection with remote client: Claude-MCP
3. Open the wave window and load the testbench signals
Ask Claude:
Open the wave window and add all testbench signals from div_tb
Claude calls:
vcc_eval("view wave")
vcc_wave_add(["sim.div_tb.*"])
All top-level testbench signals (clk_s, reset_s, dividend_s, divisor_s, quotient_s, remainder_s, start_s, busy_s) appear in the Visualizer wave window.
4. Run the simulation for 8 µs
Ask Claude:
Run the simulation for 8 microseconds
Claude calls:
vcc_run("8 us")
The simulation advances to 8 µs. The waveforms update in the Visualizer GUI, showing all the division operations carried out by the testbench.
5. Some debugging example
Ask Claude:
Did remainder_s ever equal 23 during the simulation?
Claude responds with:
  Called visualizer 16 times (ctrl+o to expand)

● Yes — remainder_s did equal 23 at some point during the simulation. Let me find the exact timestamp.

  Called visualizer (ctrl+o to expand)

● Yes, remainder_s equaled 23 during the simulation. It held that value continuously from 3890 ns to 5580 ns
  (about 1.69 µs), which corresponds to one of the division results being held stable while busy_s was
  asserted. The value then changed as the next operation completed.

✻ Churned for 1m 0s
You can continue the investigation by asking Claude:
at time 4651 ns can you confirm the value of quotient_s and remainder_s are correct for the given input values on dividend_s and divider_s?
Claude responds with:
● At 4651 ns the signal values are:

  ┌─────────────┬────────────┐
  │   Signal    │   Value    │
  ├─────────────┼────────────┤
  │ dividend_s  │ 23         │
  ├─────────────┼────────────┤
  │ divisor_s   │ 46         │
  ├─────────────┼────────────┤
  │ divsigned_s │ 1 (signed) │
  ├─────────────┼────────────┤
  │ quotient_s  │ 0          │
  ├─────────────┼────────────┤
  │ remainder_s │ 23         │
  └─────────────┴────────────┘

  Verification: 23 ÷ 46 = 0 remainder 23

  Check: (46 × 0) + 23 = 23 ✓

  Both outputs are correct. Since the dividend (23) is smaller than the divisor (46), the quotient is 0 and
  the full dividend value is returned as the remainder.

✻ Baked for 8s
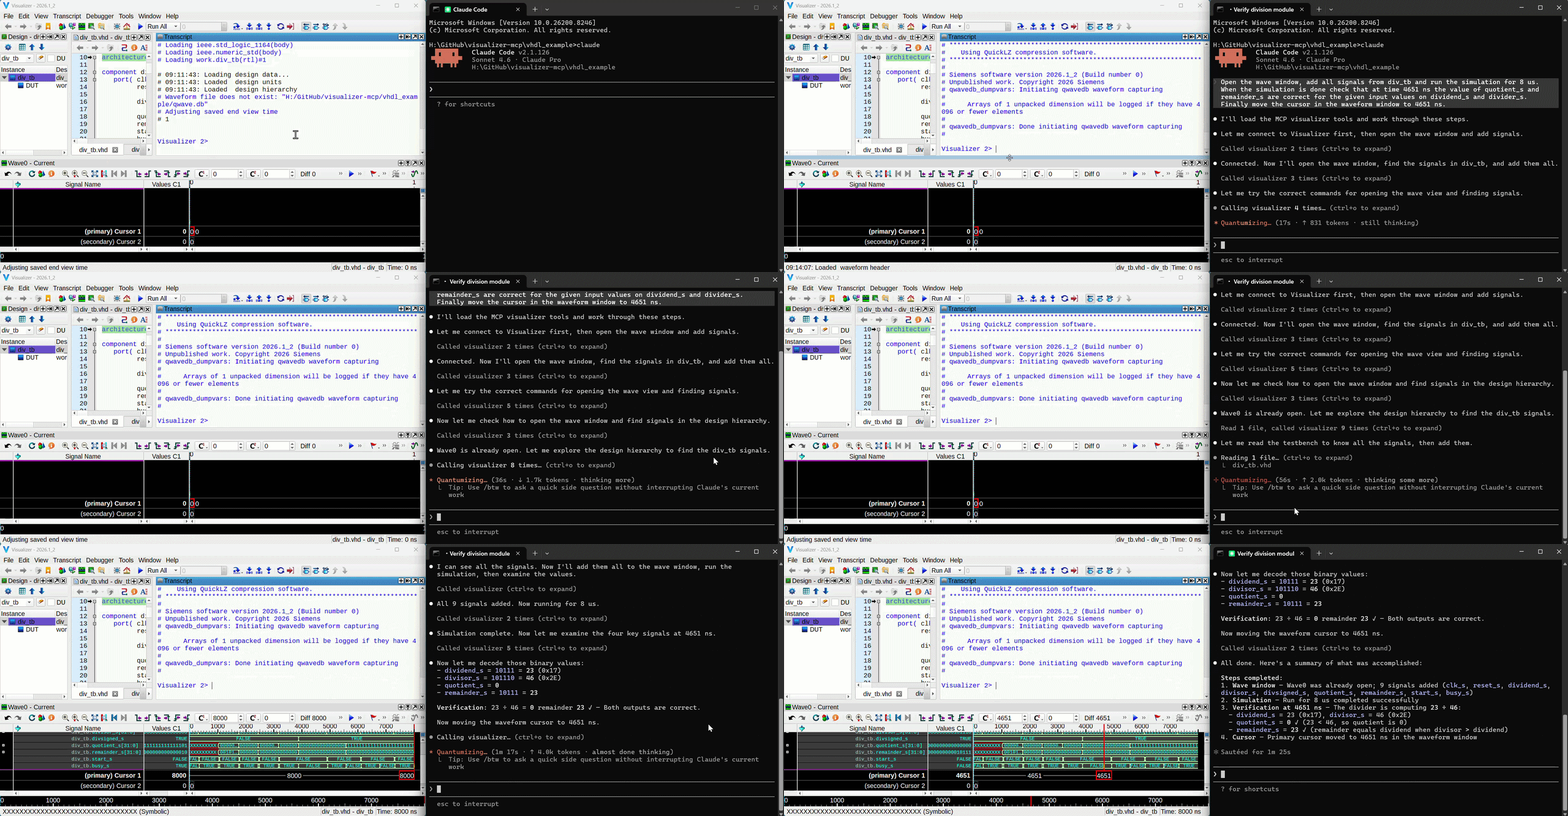
Figure: Speed up example, total run time was 89 seconds
Some general comments
- Controlling Visualizer from a Claude code prompt is slow and not very (cost) effective as simple commands will consume tokens. It is obviously easier to run a .do or qrun file. However, the reason for the demo is to show what is possible, letting the LLM control the simulation and checking the results is very interesting.
- Most of this code was created by Claude Code 4.6
- Siemens has a far more capable Questa/Visualizer mcp server called Questa Agentic Toolkit.
License
See the LICENSE file for details for this demo.
Notice
All logos, trademarks and graphics used herein are the property of their respective owners.