Wafer Map MCP Server
An MCP (Model Context Protocol) server that exposes semiconductor wafer analysis tools to AI assistants. These tools are designed for semiconductor test data analysis, enabling AI agents to correctly generate key engineering visualization charts such as wafer maps, P-charts, trend plots, and statistical analysis figures from raw test data.
Preview
| Binary Map | Property Map | P-Chart |
|---|---|---|
 | 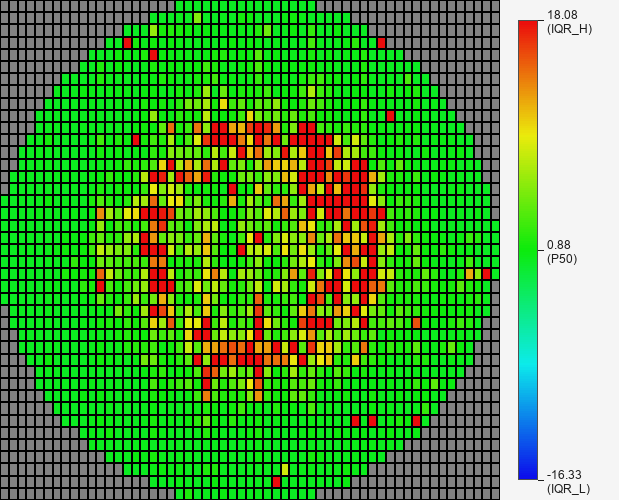 | 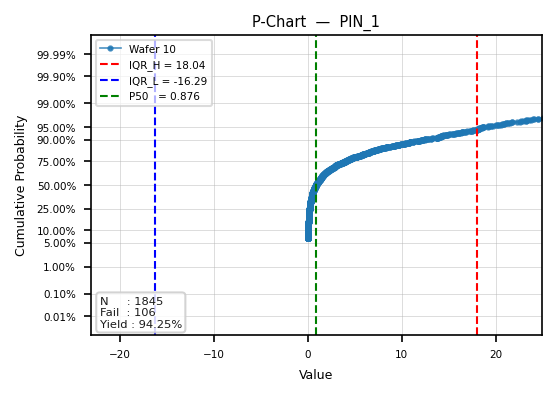 |
Tools
| Tool | Description |
|---|---|
run_wafer_analysis | Full analysis in one call: summary + binary map + all PIN maps + P-charts |
get_wafer_info | Basic wafer summary (yield, pass/fail counts, PIN columns) |
plot_wafer_bin | Binary pass/fail wafer map (BIN=0 → teal, else → black) |
plot_wafer_property | Continuous-value heatmap for a single PIN column (blue → red) |
plot_pchart | Normal probability plot per wafer for a PIN column |
Data Format
CSV or ZIP (containing exactly one CSV) with columns:
BIN, X, Y, WAFER_ID, PIN_1, PIN_2, ..., PIN_N
BIN = 0→ pass, otherwise failX,Y→ die coordinates on the wafer gridPIN_*→ continuous measurement values
Colour Scale (IQR Robust Sigma)
Property maps and P-chart boundaries use IQR-based bounds to make subtle variations visible:
sigma  = (P75 - P25) / 1.35
IQR_L  = P50 - 6 × sigma
IQR_H  = P50 + 6 × sigma
Quick Start
Option A: Docker (recommended)
docker build -t wafer-mcp .
docker run -p 8001:8001 wafer-mcp
The server is now available at http://localhost:8001/mcp.
To analyze your own data files, mount a volume:
docker run -p 8001:8001 -v /absolute/path/to/data:/data wafer-mcp
# then pass file_path="/data/your_wafer.zip" when calling tools
Option B: Local Python
Requirements: Python 3.10+
pip install -r requirements.txt
python server.py
Sample Data
A sample dataset is bundled with the project at sample_data/sample_1.zip.
| Location | Path |
|---|---|
| Local | ./sample_data/sample_1.zip |
| Docker | /app/sample_data/sample_1.zip |
Quick smoke test (Docker):
# inside the container the sample lives at /app/sample_data/sample_1.zip
# call any tool with this file_path to verify everything works
Claude Desktop Configuration
The server uses Streamable HTTP transport, so use the url form in claude_desktop_config.json:
{
  "mcpServers": {
    "wafer-map": {
      "url": "http://localhost:8001/mcp"
    }
  }
}
Steps:
- Start the MCP server (local or Docker)
- Add the config above to Claude Desktop
- Restart Claude Desktop
- Ask Claude to analyze a wafer data file — it will automatically pick the right tool
Tool Parameters
run_wafer_analysis
| Param | Type | Default | Description |
|---|---|---|---|
file_path | str | required | Path to .csv or .zip file |
pin_columns | list[str] | None | None | Subset of PIN columns to plot; None = all |
target_size | int | 300 | Output image pixel size |
get_wafer_info
| Param | Type | Default | Description |
|---|---|---|---|
file_path | str | required | Path to .csv or .zip file |
plot_wafer_bin
| Param | Type | Default | Description |
|---|---|---|---|
file_path | str | required | Path to .csv or .zip file |
target_size | int | 300 | Output image pixel size |
plot_wafer_property
| Param | Type | Default | Description |
|---|---|---|---|
file_path | str | required | Path to .csv or .zip file |
pin_column | str | "PIN_1" | PIN column to visualise |
target_size | int | 450 | Output image pixel size |
data_l | float | None | None | Override lower bound of colour scale |
data_h | float | None | None | Override upper bound of colour scale |
plot_pchart
| Param | Type | Default | Description |
|---|---|---|---|
file_path | str | required | Path to .csv or .zip file |
pin_column | str | "PIN_1" | PIN column to plot |
target_size | int | 300 | Output image pixel size |
Project Structure
.
├── server.py                    # MCP server entry point
├── requirements.txt             # Python dependencies
├── Dockerfile                   # Container definition
├── sample_data/
│   └── sample_1.zip             # Bundled sample wafer dataset
├── tools/
│   ├── workflow/
│   │   └── analyze_wafer.py     # Orchestrates full analysis
│   ├── information_read/
│   │   └── read_wafer_info.py   # Parse CSV/ZIP and compute yield
│   ├── wafer_map/
│   │   ├── wafer_bin_binary_plot.py    # Binary map renderer (PySide6)
│   │   └── wafer_item_property_plot.py # Property heatmap renderer (PySide6)
│   └── statistic_plot/
│       └── pchart_plot.py       # P-chart renderer (matplotlib)
└── pchart/
    └── PchartReportWidget.py    # Legacy Qt widget (reference only)
Tech Stack
- MCP: FastMCP — Streamable HTTP transport
- Wafer map rendering: PySide6 offscreen QPainter
- P-chart rendering: matplotlib + scipy + statsmodels
License
MIT